


Introduction
Polyhydroxyalkanoates (PHAs) are a heterogeneous family of polyesters of microbial origin. These compounds have gained significant interest due to their comprehensive green lifecycle and unique physicochemical properties resembling synthetic plastics (Akaraonye et al., 2010; Koller et al., 2017). Being biogenic, PHAs are nontoxic, biodegradable, and biocompatible and are considered eco-friendly alternatives for hazardous fossil fuel-derived recalcitrant thermoplastics, which lack effective recycling strategies and thus have adverse environmental consequences (Kumar et al., 2020). Under unbalanced growth conditions with an excess of carbon, diverse microbial systems, including bacteria and archaea derived from different ecological niches, can accumulate a substantial amount of PHAs as intracellular reserve polymers (Lu et al., 2009; Poli et al., 2011; Tan et al., 2014).
Despite having huge potential, the production and commercialization of PHAs are still limited mainly due to the high cost of substrates and cosubstrates as well as insufficient infrastructure for industrial production (Kalia et al., 2021; Tan et al., 2021). The cost of feedstock is the major factor that influences the fermentation cost, which accounts for approximately 30–50% of the total PHA processing cost (Martínez-Avila et al., 2021). This cost can be effectively minimized using readily available feedstock such as industrial, agricultural, municipal, and food-based wastes (Li and Wilkins, 2020; Bhatia et al., 2021). Of these, agro-industrial by-products (AIBPs) are of particular interest as they are rich in carbon and can be efficiently transformed into valueadded biomaterials, including PHAs (Israni and Shivakumar, 2020; Kee et al., 2020). Recent studies have estimated that with the use of such by-products, the cost of PHA production can be eventually reduced by almost 50% (Kumar et al., 2018; Saratale et al., 2021). Generally, a single or an integrated pretreatment of AIBPs involving chemical (acid or alkali) or enzymatic hydrolysis is often required. From economic and ecological perspectives, bioconversion of AIBPs by a suitable bacterial strain is desirable to reduce the steps in PHA production, the use of harsh chemicals, and the release of toxic compounds and effluents to the environment (Koller et al., 2017; Adeleye et al., 2020). Nevertheless, industry-scale implementation also requires new and advanced technologies that facilitate the utilization of inexpensive raw materials such as AIBPs (Rodriguez-Perez et al., 2018).
Sugarcane molasses is a complex viscous residue formed as a by-product in sugarcane industries and is widely used as a substrate in biotechnological processes (Dalsasso et al., 2019). Over the past few decades, an increasing number of biomaterials, such as polysaccharides, oligosaccharides, organic acids, and enzymes, have been produced through microbial fermentation using sugarcane molasses (Zhang et al., 2021). The key constituent of molasses, including sucrose, glucose, and fructose, as well as Fe, Mg, Ca, K, and vitamins (B7) in trace amounts, act as supplements for the growth of bacteria and archaea (Kumar et al., 2020). Sugarcane molasses has been validated as a competent substrate for the production of PHAs, especially poly(3-hydroxybutyrate) [P(3HB)], with the use of a wide variety of bacteria, including Acinetobacter nosocomialis (Reddy et al., 2018), Alcaligenes sp. (Tripathi et al., 2019), Cupriavidus necator (Dalsasso et al., 2019), Halomonas boliviensis (Ortiz Veizán et al., 2020), Parapedobacter sp. (Tyagi et al., 2021), Pseudomonas aeruginosa (Tripathi et al., 2012), Ralstonia eutropha (Acosta-Cárdenas et al., 2018), and Rhodopseudomonas sp. (Carlozzi et al., 2019). However, the utilization of sugarcane molasses alone or with additional cosubstrates has only recently been acknowledged for the production of PHA copolymers, namely poly(3-hydroxybutyrate-co-3-hydroxyvalerate) [P(3HB-co-3HV)] (de Paula et al., 2021; García et al., 2019; Morya et al., 2021), poly(3-hydroxyoctanoate-co-3-hydroxydecanoate) [P(3HO-co-3HD)] (Basnett et al., 2020), and poly(3-hydroxybutyrate-co-lactate) [P(3HB-co-LA)] (Jo et al., 2021). In particular, Bacillus sp. are recognized as ideal organisms for the use of molasses along with various other AIBPs for efficient production of P(3HB) (Sharma and Bajaj, 2015; Penkhrue et al., 2019; Evangeline and Sridharan, 2019; Suryawanshi et al., 2020).
Besides less expensive feedstock, using an inexpensive fermentation technology is also an essential prerequisite for the large-scale production of PHA. The development of a suitable bioprocess is equally important to support the growth of the producer organisms and maximize the PHA titer and intracellular accumulation (Li and Wilkins, 2020). Moreover, PHA production is significantly influenced by various physical, chemical, and biological parameters, and optimization of these individual variables is crucial for PHA bioprocessing (Reddy et al., 2018). Classical optimization methods such as “one variable at a time” (OVAT) are time-consuming and inadequate to interpret the interactive effects of multiple factors that influence PHA production. Response surface methodology (RSM) has been established as an excellent and reliable statistical tool to assess the linear, quadratic, and interactive terms of process variables which is widely used to predict the optimal factor combination for achieving the maximum target response and has also been successfully implemented recently for PHA production (Evangeline and Sridharan, 2019; Tripathi et al., 2019).
Bacillus cereus RCL 02, a bacterium endophytic to the leaves of the oil-yielding plant Ricinus communis L., has been reported to be able to synthesize and intracellularly accumulate P(3HB) (Das et al., 2017), as well as the copolyesters of 3-hydroxybutyrate (3HB) and 3-hydroxyvalerate (3HV), while growing in a mineral salt (MS) medium (Das et al., 2018). To meet the existing need for a cost-efficient method for PHA production, the isolate RCL 02 has also been exploited for the production of P(3HB-co-3HV)] using sugarcane molasses (Das et al., 2019). The present study aimed at the RSM-based statistical optimization of some process variables that influence the production of the PHA copolymer by B. cereus RCL 02 using untreated raw sugarcane molasses without supplementation of the fermentation medium with additional precursors or cosubstrates.
Materials and methods
Bacterial strain and storage conditions
The endophytic strain B. cereus RCL 02 (MCC Accession No. 3436; GenBank Accession No. KX458035) derived from the leaves of the oil-producing plant R. communis L. (Das et al., 2017) was used in this study. The bacterial culture was maintained by regular subculturing on slopes of tryptic soy agar medium that contained the following components (in g/l): casein enzymic hydrolysate, 17.0; papaic digest of soybean meal, 3.0; KH2PO4, 2.0; NaCl, 5.0; and agar, 20.0. The pH of the medium was adjusted to 7.3.
Growth and production medium
Growth and production of the polymer by the endophyte B. cereus RCL 02 were evaluated via batch cultivation in the modified MS medium (Ramsay et al., 1990) containing the following components (in g/l): Na2HPO4 ∙ 7H2O, 6.7; KH2PO4, 2.0; (NH4)2SO4, 1.0; and MgSO4 ∙ 7H2O, 1.0. The medium was supplemented with commercially available sugarcane molasses which was separately sterilized. The pH value of the medium was adjusted to 7.0 prior to inoculation. An Erlenmeyer flask (100 ml) containing 25 ml of the prepared medium was inoculated at the 2% level with an overnight-grown culture of B. cereus RCL 02. The flask was incubated at 32°C on a rotary shaker at 120 rpm.
Analytical study
Measurement of growth
Bacterial growth was determined by measuring the dry weight of the cell mass. Following incubation for 36, 54, and 72 h under continuous shaking (120 rpm), the culture was centrifuged (12 000 × g for 10 min) at 4°C, and the resulting cell pellet was washed thoroughly with deionized water and acetone. Subsequently, the harvested cell mass was dried overnight in a preweighed aluminum cup at 80°C in a hot air oven, cooled to room temperature in a desiccator, and then weighed. The growth experiments were performed in triplicate, and the average value was used for the calculation. The dried cell mass was also considered for the extraction and quantification of PHA.
Extraction and purification of synthesized PHA
To extract the intracellularly accumulated PHA polymer, the dried cell mass (2 mg) was treated with 20 ml of warm chloroform (40–45°C) for 2–4 h, and the process was repeated thrice. The chloroform fractions were pooled, filtered through glass wool, concentrated to 5 ml following evaporation at room temperature, and subsequently precipitated with double the volume of prechilled diethyl ether. To obtain the purified polymer, the fractions were precipitated by centrifugation (16 000 × g for 12 min, at 4°C), washed with acetone followed by dehydrated ethanol, redissolved in 5 ml of chloroform, filtered through Whatman filter paper, and reprecipitated with double the volume of chilled diethyl ether. Finally, the polymer was separated by centrifugation (16 000 × g for 12 min, at 4°C) and air-dried.
Quantification of PHA by crotonate assay
Using the crotonate assay method of Law and Slepecky (1961), the 3HB content of the extracted and purified polymer was estimated. Briefly, the dried polymer sample (2 mg) was treated with 5 ml of concentrated H2SO4 in a boiling water bath for 10 min, cooled to room temperature, and then subjected to UV spectral analysis. Using a UV-VIS spectrophotometer (Jenway, Model 6505), the absorbance of the treated polymer was read at 200–300 nm, and the characteristic absorption at 235 nm was determined. The amount of P(3HB) was determined from the calibration curve prepared in the same way using commercially available P(3HB) (Sigma-Aldrich, USA). The total PHA content of the cell mass was quantified by the gravimetric method (Ulmer et al., 1994; Mukhopadhyay et al., 2013).
Optimization of growth and PHA production by RSM
Multifactorial experimental design
The matrix for the RSM optimization was obtained through the Box–Behnken design (BBD) (Box and Behnken, 1960) using the Design-Expert software (version 13.0.1.0) (Stat-Ease, Inc. MN, USA). Four independent variables, namely carbon source (molasses), nitrogen source (ammonium sulfate), initial pH of the medium, and incubation time, were used at three distinct coded levels (−1, 0, +1). Altogether, a design of 30 randomized experiments with different concentrations and combinations of the influencing variables was articulated, and the experiments were performed in triplicate.
The real levels of the independent variables were coded using the following equation:
where Z is the dimensionless coded value and Zi is the real value of the independent variable; Z0 is the value of the independent variable at the central point; and ΔZ is the step change value.
The experimental data obtained from the design were analyzed by multiple regression analysis using least squares to fit the model. The scalar notation of the general quadratic equation for the variables growth (Y1) and PHA production (Y2) is as follows:
where Y is the predictive response variable, β0 model intercept, XiXj is the coded value of the independent variable, βi is the linear coefficient, βij is the interactive cross-product coefficient, and βii is the quadratic coefficient.
Statistical analysis
Statistical analysis was performed using the Design-Expert software, version 13.0.1.0, and the consistency of the model was evaluated by analysis of variance (ANOVA). Statistical significance of the model equation and terms were determined by Fisher’s F -test at the 5% level of probability (P < 0.05). The proportion of variance explained by the model was presented by multiple coefficients of determination (R 2) and adjusted R 2. The statistical accuracy of the model was verified by the lack-of-fit (LOF) assessment. The precision of the performed experiments was analyzed by calculating the percent coefficient of variation (C.V. %).
To elucidate the interaction between significant process variables and their influence on growth (Y1) and PHA production (Y2), two-dimensional (2D) contour and three-dimensional (3D) response surface plots were generated. These plots were prepared by plotting growth and PHA production responses on the Z-axis against any two independent variables within their experimental range while keeping the other independent variables constant.
Validation of the statistical model
The statistical model was validated using the point prediction tool of RSM. To validate the model and rationalize the predicted values of the response variables, a test was conducted in triplicate using the optimum estimates of independent variables. Results from the confirmation experiments were compared with those obtained via numerical optimization.
Proton nuclear magnetic resonance ( 1H NMR) spectroscopic analysis
The purified PHA polymer was subjected to 1H NMR analysis in order to define its chemical structure. Briefly, about 5 mg of PHA isolated and purified from B. cereus RCL 02 was dissolved in 1 ml of analytical-grade deuterated chloroform (CDCl3), and high-resolution NMR spectra were recorded in a Bruker Ultra Shield-600 MHz NMR spectrophotometer, with the flip angle of the multinucleate probe head set at 30° and probe temperature at 27°C. The chemical shifts, i.e., resonance signals, is the were represented on the δ scale [parts per million (ppm)], and tetramethylsilane (Me4Si) was used as the internal standard.
Results and discussion
Recently, Das et al. (2019) investigated the synthesis and accumulation of PHA copolymers (7.8 g/l) by the endophytic bacterium B. cereus RCL 02 grown under shake-flask culture in a modified MS medium supplemented with sugarcane molasses. The authors reported that carbon source (molasses), nitrogen source (ammonium sulfate), initial pH, and incubation time potentially influenced the production of both PHA homopolymer and copolymer, based on the OVAT methodology of optimization (Das et al., 2017; 2018; 2019). Therefore, in the present study, these four independent variables were chosen for statistical optimization, whereas the remaining variables were kept constant.
RSM-based optimization of process variables for growth and PHA production
Using the BBD of RSM, the optimal levels of the process variables and their interactive effect on maximum growth and PHA production by the endophytic isolate B. cereus RCL 02 were assessed. The following independent variables were assessed in the analysis: molasses (X1), ammonium sulfate (X2), initial pH (X3), and incubation time (X4) – Table 1. Thirty randomized trials were designed based on the BBD with different concentrations and combinations of values of the independent variables at minimum (−1), central (0), and maximum (+1) levels. The matrix developed using the BBD and the experimental results obtained for the response variables growth (Y1) and PHA production (Y2) are shown in Table 2. The experimental results indicated that the quadratic model was appropriate for navigating the design space. To predict the values of the response variables (Y1 and Y2), the coeffcients of the polynomial equation were computed from the experimental data. The polynomial equations obtained using multiple regression analysis for both response variables were as follows:
(3)
(4)
Table 1
Coded levels of the independent variables used for the assessment of growth and PHA production by B. cereus RCL 02 based on BBD
| Independent variable | Symbol | Coded level | ||
|---|---|---|---|---|
| −1 | 0 | +1 | ||
| Molasses [g/l] | X1 | 20 | 40 | 60 |
| Ammonium sulfate [g/l] | X2 | 1 | 3 | 5 |
| pH | X3 | 6 | 6.5 | 7 |
| Incubation time [h] | X4 | 36 | 54 | 72 |
Table 2
Experimental design based on BBD and the observed values for growth and PHA production by B. cereus RCL 02
[i] Each experimental value represents the mean of three replicates ± standard deviation; growth was determined by measuring the dry weight of cell mass, and production of PHA was quantified following chemical estimation (Law and Slepecky, 1961) and gravimetric methods
Adequacy of the statistical models for growth and PHA production
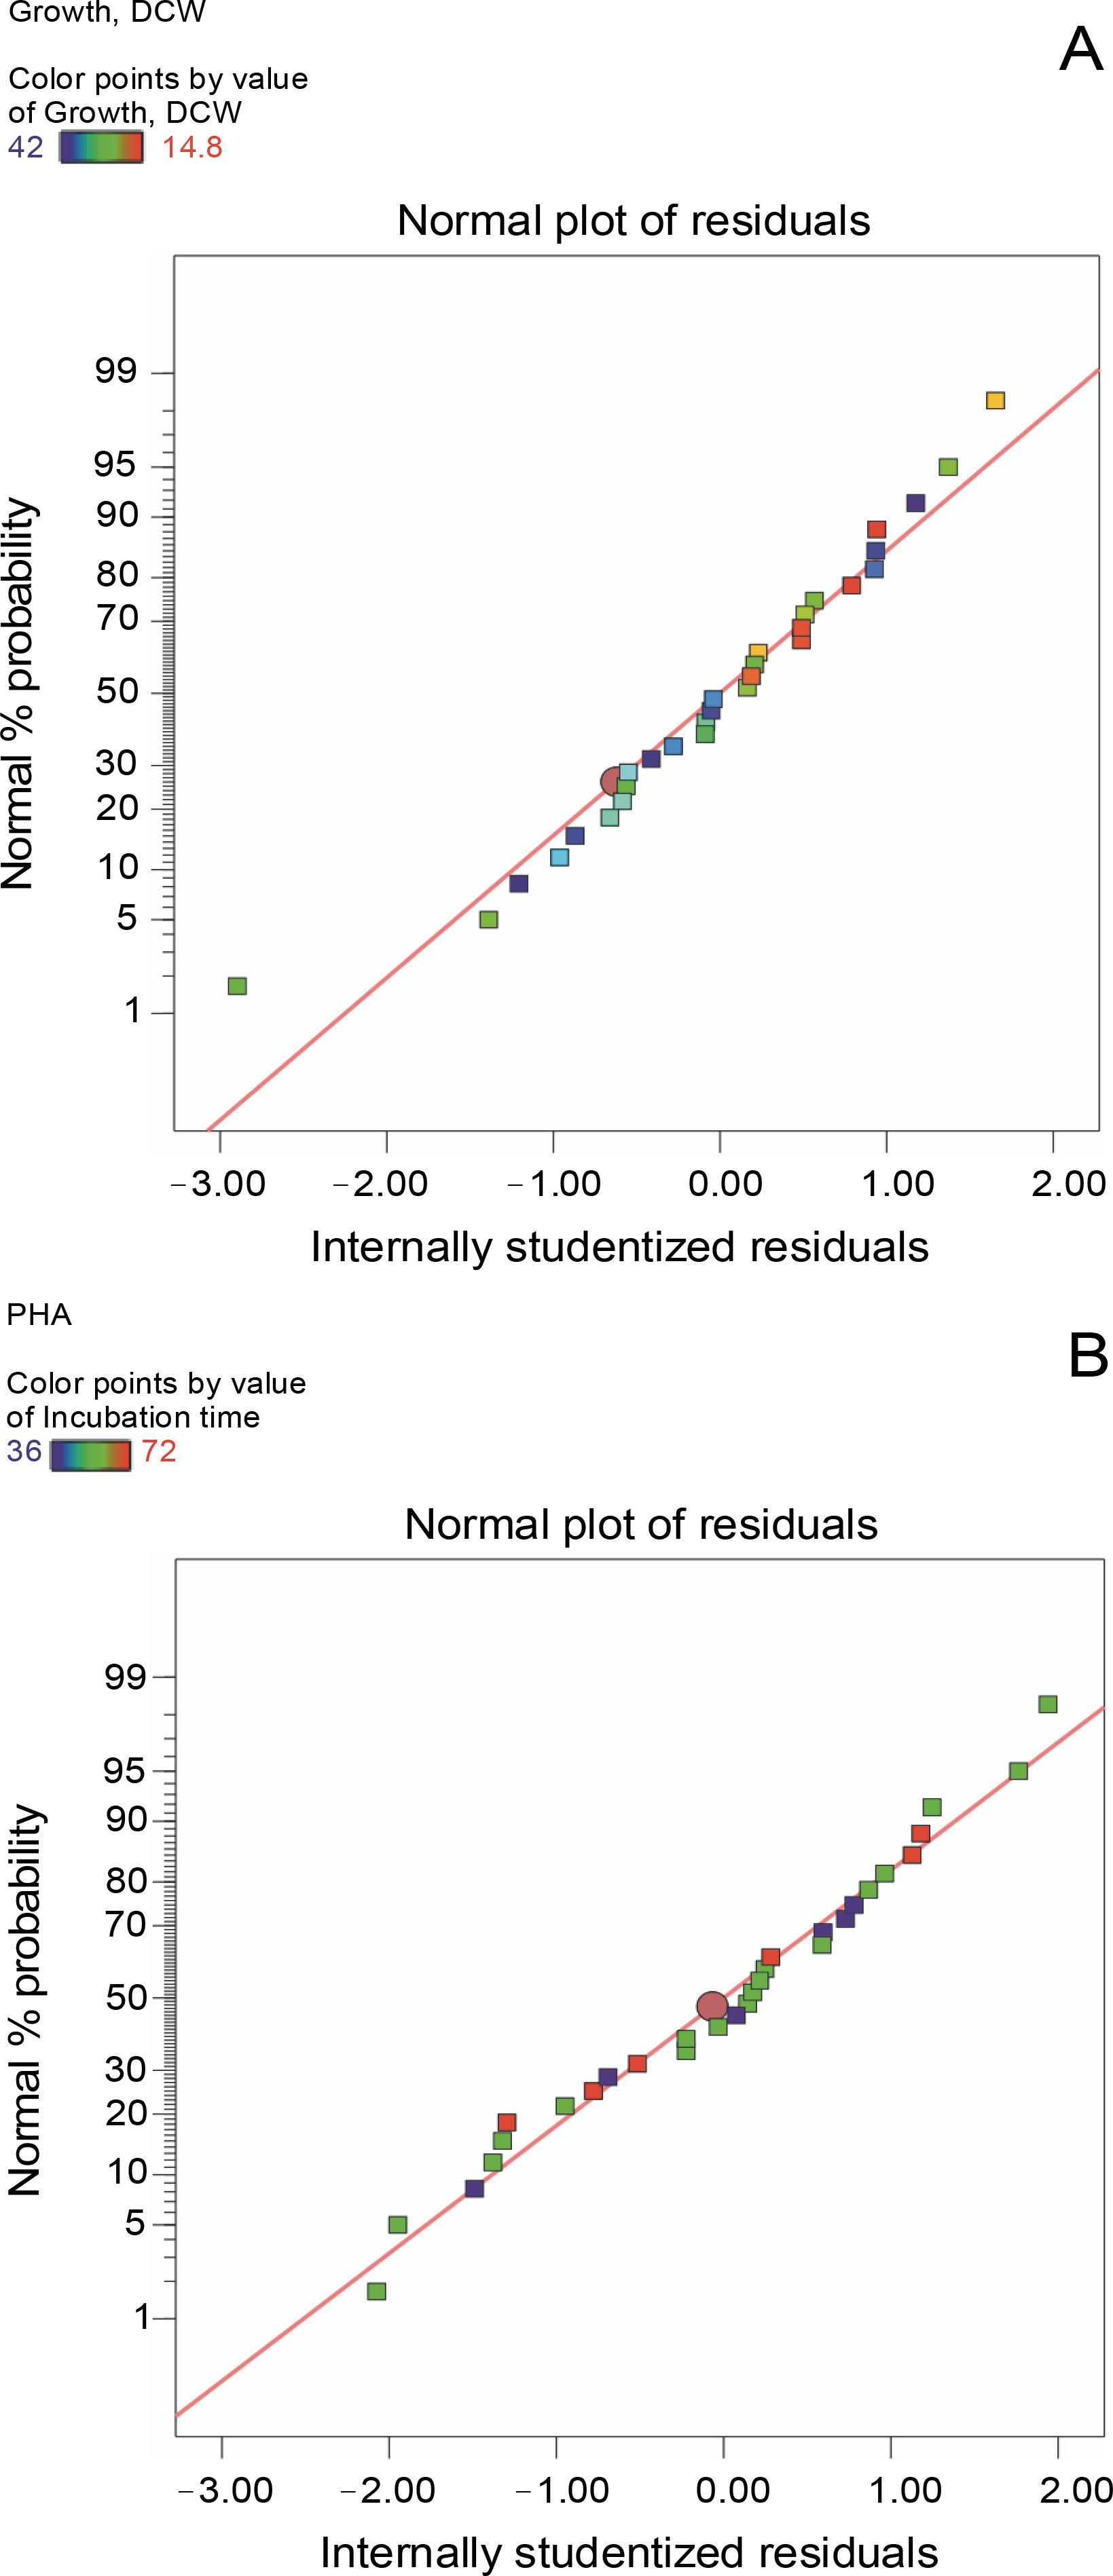
The aptness of the models for growth (Y1) and PHA production (Y2) was determined based on the plots of correlation between the predicted and the actual responses (Fig. 1) and the normal probability plots of residuals (Fig. 2). Aggregation of the points around the diagonal line, as shown in Fig. 1A and Fig. 1B, assured the reliable correlation between the actual and predicted values for growth (Y1) and PHA production (Y2). The predicted values of Y1 and Y2 calculated using the regression analysis revealed a high degree of correlation with the corresponding experimental data. These findings clearly indicate that the actual values of both the response variables were in good agreement with the predicted values and thus supported the adequacy of the proposed models. Similarly, normal probability plots for Y1 (Fig. 2A) and Y2 (Fig. 2B) revealed the accretion of residuals adjacent to the diagonal line, suggesting their independent normal distribution and the close proximity of the experimental values with the predicted ones.
Fig. 1
Graphical representation of correlation between A) actual (straight line) and predicted (squared) responses for growth and B) PHA production using BBD

The significance of the models for growth and PHA production was assessed using ANOVA. The ANOVA of the regression models for variables growth (Table 3) and PHA production (Table 4) confirmed that both models were statistically significant (Fmodel > 1, significant). The model F-values, estimated based on Fisher’s F-test, were 10.5 and 19.21 for growth and PHA production, respectively. It should be noted that the F-value is a statistical measure of how well the factors describe the variation in the data around their mean (Tripathi et al., 2019). The greater the F -value is from unity, the more certain it is that the factors adequately explain the variation in the data and that the estimated coefficients of the factors are real. In the present study, the model F-values of 10.5 and 19.21 estimated for Y1 and Y2, respectively, and their very low corresponding probability values (P < 0.0001) clearly indicated that both the constructed models were significant for understanding the interactive effect of independent variables. In addition, LOF measures the inability of the model to represent the data at points that are excluded from the regression (Adetunji and Olaniran, 2020). The LOF values of 0.3639 and 2.34 determined for Y1 and Y2, respectively, implied that they were not significant relative to the pure error. The insignificant LOF indicated the statistical accuracy and robustness of the models, which were sufficient enough to predict the response variables under any combination of the variable values.
Table 3
ANOVA based on the quadratic polynomial model for the growth of the endophytic bacterium B. cereus RCL 02
| Source | Sum of squares | Degree of freedom | Mean square | F -value | P -value |
|---|---|---|---|---|---|
| Model | 311.54 | 14 | 22.25 | 10.50 | < 0.0001 *** |
| X1 | 48.40 | 1 | 48.40 | 22.84 | 0.0002 *** |
| X2 | 1.76 | 1 | 1.76 | 0.8322 | 0.3761 |
| X3 | 36.05 | 1 | 36.05 | 17.02 | 0.0009 *** |
| X4 | 19.51 | 1 | 19.51 | 9.21 | 0.0084 *** |
| X1X2 | 4.84 | 1 | 4.84 | 2.28 | 0.1515 |
| X1X3 | 5.76 | 1 | 5.76 | 2.72 | 0.1200 |
| X1X4 | 1.56 | 1 | 1.56 | 0.7374 | 0.4040 |
| X2X3 | 1.56 | 1 | 1.56 | 0.7374 | 0.4040 |
| X2X4 | 0.0025 | 1 | 0.0025 | 0.0012 | 0.9731 |
| X3X4 | 9.92 | 1 | 9.92 | 4.68 | 0.0470 ** |
| 91.98 | 1 | 91.98 | 43.41 | < 0.0001 *** | |
| 74.67 | 1 | 74.67 | 35.24 | < 0.0001 *** | |
| 66.96 | 1 | 66.96 | 31.60 | < 0.0001 *** | |
| 10.08 | 1 | 10.08 | 4.76 | 0.0455 ** | |
| Residual | 31.78 | 15 | 2.12 | ||
| Lack of fit | 13.39 | 10 | 1.34 | 0.3639 | 0.9184 |
| Pure error | 18.40 | 5 | 3.68 | ||
| Cor total | 343.32 | 29 |
Table 4
ANOVA based on the quadratic polynomial model for PHA production by the endophytic bacterium B. cereus RCL 02
| Source | Sum of squares | Degree of freedom | Mean square | F-value | P-value |
|---|---|---|---|---|---|
| Model | 6690.78 | 14 | 477.91 | 19.21 | < 0.0001 *** |
| X1 | 1142.70 | 1 | 1142.70 | 45.93 | < 0.0001 *** |
| X2 | 53.76 | 1 | 53.76 | 2.16 | 0.1622 |
| X3 | 430.80 | 1 | 430.80 | 17.32 | 0.0008 *** |
| X4 | 894.41 | 1 | 894.41 | 35.95 | < 0.0001 *** |
| X1X2 | 394.02 | 1 | 394.02 | 15.84 | 0.0012 *** |
| X1X3 | 226.50 | 1 | 226.50 | 9.10 | 0.0087 *** |
| X1X4 | 49.70 | 1 | 49.70 | 2.00 | 0.1779 |
| X2X3 | 13.32 | 1 | 13.32 | 0.5355 | 0.4756 |
| X2X4 | 26.01 | 1 | 26.01 | 1.05 | 0.3228 |
| X3X4 | 105.06 | 1 | 105.06 | 4.22 | 0.0577 |
| 2423.59 | 1 | 2423.59 | 97.42 | < 0.0001 *** | |
| 722.19 | 1 | 722.19 | 29.03 | < 0.0001 *** | |
| 1029.00 | 1 | 1029.00 | 41.36 | < 0.0001 *** | |
| 168.87 | 1 | 168.87 | 6.79 | 0.0199 *** | |
| Residual | 373.18 | 15 | 24.88 | ||
| Lack of fit | 307.53 | 10 | 30.75 | 2.34 | 0.1800 |
| Pure error | 65.65 | 5 | 13.13 | ||
| Cor total | 7063.96 | 29 |
The coefficient of determination (R 2) values for Y1 and Y2 were recorded at 0.9074 and 0.9472, respectively, which implied the accuracy of both models with appreciable predictability (Table 5). The R 2 value measures the “goodness of fit”, and its proximity to 1 denotes a better correlation between the observed and predicted responses (Sharma and Bajaj, 2017). However, lower R 2 values indicate that the response variables are not appropriate to explain the variation. In the present study, the R 2 values obtained for growth (Y) and PHA production (Y2) indicated that approximately 91% and 95% variability could be explained by the respective models. The adjusted R 2 values, which corrects the R 2 value for the sample size and number of terms, were recorded at 0.8210 and 0.8979 for Y1 and Y2, respectively. The predicted R 2 for Y1 was 0.6982 and for Y2 was 0.7395. The difference between the adjusted and the predicted R 2 was less than 0.2 for both response variables (Y1 and Y2), and hence, a reasonable agreement was found. The adequate precision measures the signal (response) to noise (deviation) ratio. As reported in a previous study, a ratio greater than 4 (S/N > 4) is desirable (Sharma and Bajaj, 2015). In the present study, ratios of 10.157 and 14.421 for Y1 and Y2, respectively, indicated adequate signal, and thus, these models could be suitably used to navigate the design space. The percent coefficient of variation (C.V. %) is a statistical parameter that indicates the reliability of the experiment and provides information regarding the degree of precision with which the experiments were performed (Adetunji and Olaniran, 2020). In this case, the C.V. % of 16.12% and 7.93% determined for Y1 and Y2, respectively, indicated the accuracy and consistency of the generated models.
Table 5
Statistical parameters of the polynomial model designed for growth and PHA production by the endophytic bacterium B. cereus RCL 02
Interactive effect of independent variables
The linear terms of independent variables, namely molasses (X 1), initial pH (X 3), and incubation time (X 4), were found to be significant (P < 0.05) – Table 3 – for growth (Y 1). When quadratic terms were considered, all the four variables (
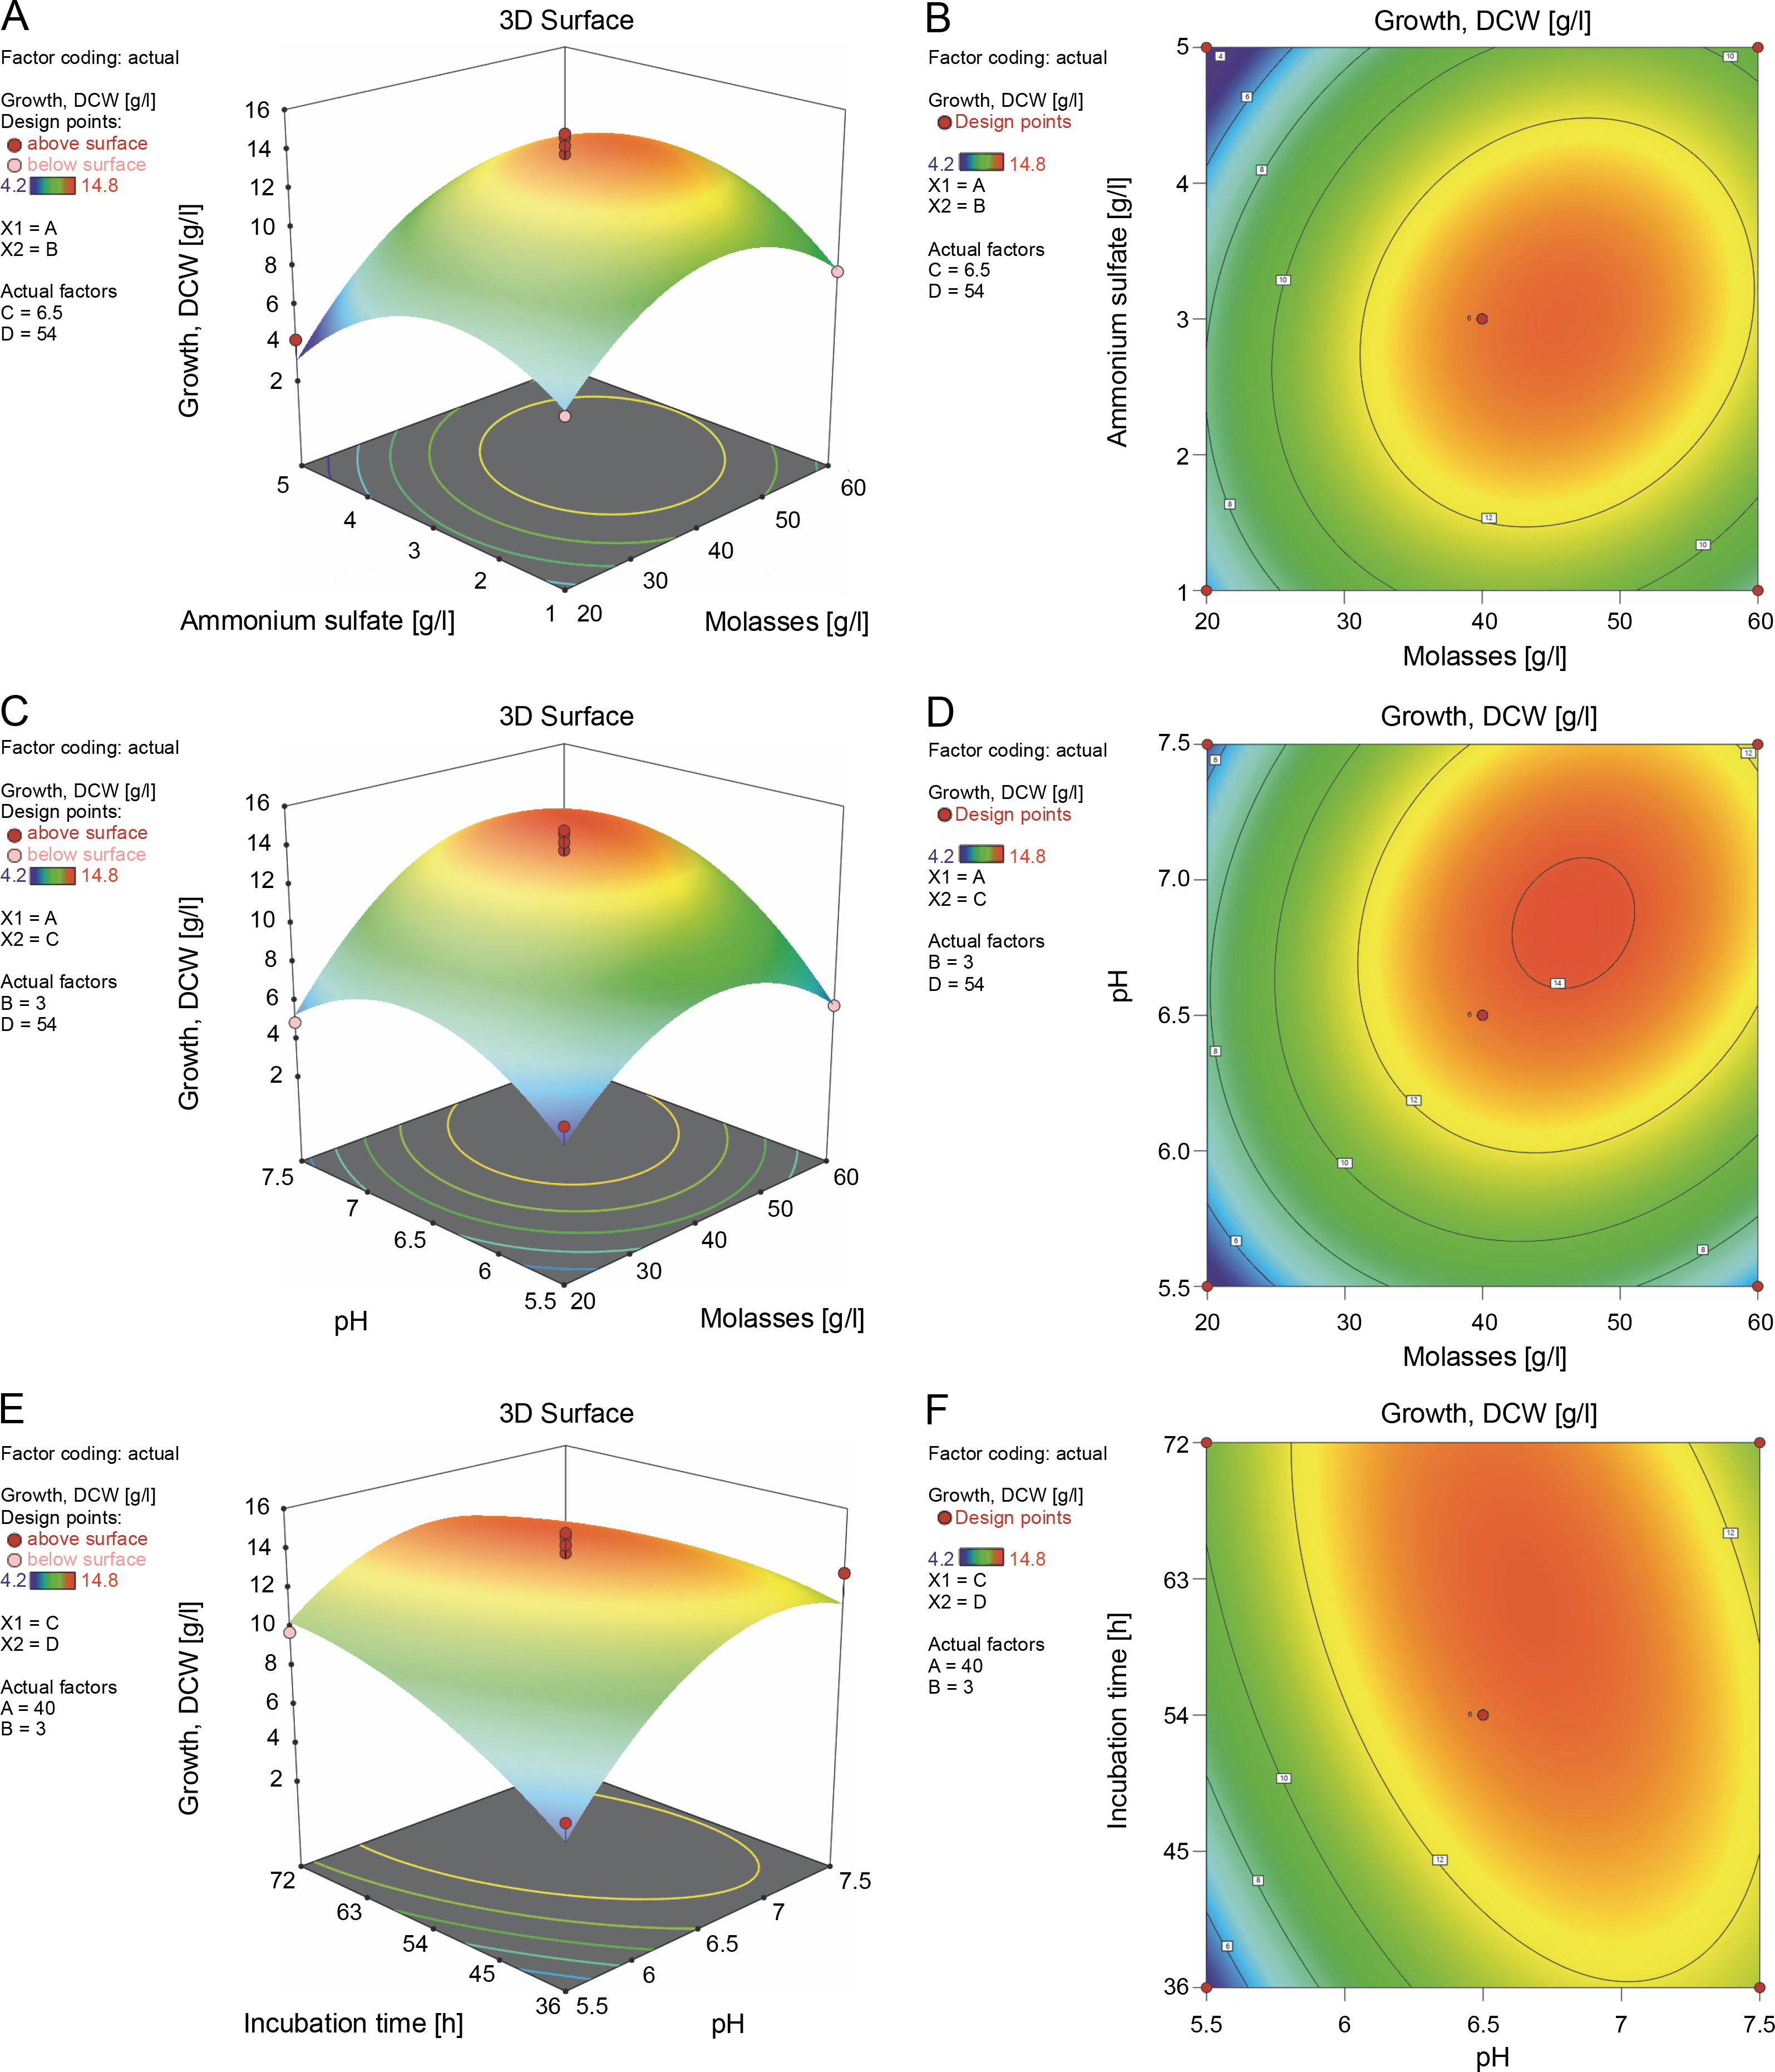
Furthermore, the 2D contour and 3D response surface plots were analyzed to better comprehend the combinational effects among the interacting variables for growth and biopolymer production. An elliptical contour plot is designated for a significant interactive effect between the variables, whereas a circular contour plot is designated for nonsignificant interactions between the corresponding variables (Suryawanshi et al., 2020). In the present study, the elliptical contour plot, as shown in Fig. 3F, clearly indicated that the interactive effect of initial pH (X 3) and incubation time (X 4) most significantly influenced biomass formation (Y 1) as compared to the interactive effect of molasses (X 1) and ammonium sulfate (X 2) (Fig. 3B) and that of molasses (X 1) and initial pH (X 3) (Fig. 3D). The response surface plot (Fig. 3E) clearly showed that an initial pH (X 3) of 6.7 and incubation time (X 4) of 62 h supported the maximum biomass formation by B. cereus RCL 02. However, a further increase in these two variables inhibited the growth. The molasses (X 1) and ammonium sulfate (X 2) response surface interaction plot (Fig. 3A) showed a concomitant increase in biomass formation with an increasing concentration of molasses beyond the center points nearly reaching the periphery. In contrast, the curvature of the 3D response plot (Fig. 3C) corresponding to the interaction between molasses (X1) and initial pH (X3) indicated a decreasing growth of the isolate B. cereus RCL 02 with an increasing pH toward the periphery.
Fig. 3
Response surface and contour plots showing the interactive effect of molasses and ammonium sulfate (A and B), molasses and pH (C and D), and pH and incubation time (E and F) for the growth of the endophytic isolate B. cereus RCL 02
The interaction between molasses (X1) and ammonium sulfate (X2) had a remarkable influence on polymer production, which was clearly evident from both the response (Fig. 4A) and the contour plots (Fig. 4B). A gradual increase in polymer accumulation was observed with an increasing concentration of molasses. These results thus are in line with the previously reported growth-associated polymer biosynthesis by the endophytic isolate B. cereus RCL 02 (Das et al., 2017, 2019). Increasing the molasses concentration beyond 47 g/l reduced polymer accumulation, which might be due to substrate inhibition, changes in the osmoticum, and/or the interference of other impurities present in molasses. Reddy et al. (2018) have previously reported a similar observation of mutual interaction between these two variables, where the maximum production of P(3HB) (7.82 g/l) by A. nosocomialis RR20 was attained with 28 g/l of molasses and 3.2 g/l of ammonium sulfate. Moreover, Suryawanshi et al. (2020) indicated that the carbon (molasses) and nitrogen (urea) sources were the most critical control factors influencing the production of P(3HB) by B. cereus 2156. On the contrary, the interactive effect between molasses, ammonium sulfate, and initial pH was found insignificant and failed to affect PHA production by B. cereus VIT-SSR1 (Evangeline and Sridharan, 2019). The response surface (Fig. 4C) and contour plots (Fig. 4D) representing the interactive effect of molasses (X 1) and initial pH (X 3) also showed a positive impact on PHA accumulation by the endophytic isolate B. cereus RCL 02. However, the interactive effect of initial pH (X 3) and incubation time (X 4) (Fig. 4E and Fig. 4F) did not have much influence on PHA production by this species. In contrast, Hassan et al. (2019) well described the influence of pH and incubation time on the production of P(3HB) by Bacillus subtilis.

Validation of the statistical model
The model used was verified by conducting the experiments in triplicate under optimal conditions as predicted by the point prediction tool of RSM. The most favorable conditions predicted for the maximum growth of biomass and PHA production were as follows: molasses 47 g/l, ammonium sulfate 3 g/l, initial pH 6.7, and incubation time 62 h. Under such optimal conditions, the biomass and PHA production were recorded to be 14.8 g/l and 85.2% dry cell weight (DCW), respectively, which were almost equivalent to the predicted values (14.4 g/l and 86.8% DCW, respectively) (Table 6). Therefore, it was clear that the predicted and experimental values were in good agreement, manifesting the validity of both the models.
Table 6
Optimum values of the independent variables and confirmatory trials for the predicted responses under optimal conditions
In the literature, the endophytic isolate B. cereus RCL 02 has already been reported to produce biomass of 9.4 g/l with a PHA content of 83.5% using sugarcane molasses, based on the OVAT methodology of optimization (Das et al., 2019). It is therefore apparent from the present study that the RSM-based optimization effectively enhanced the PHA yield by 1.6-fold (7.8–12.6 g/l) as compared to the conventional OVAT methodology. Moreover, the PHA production (12.6 g/l) efficiency of the endophytic isolate B. cereus RCL 02 was found to be quite satisfactory compared with the efficiency of other nonendophytic bacterial strains, with the use of sugarcane molasses (Table 7).
Table 7
Fermentative utilization of molasses as the carbon source for the production of PHA copolymers by different natural and recombinant bacterial strains
| Organism | Carbon substrate utilized | Type of PHA copolymer produced | PHA content [%, DCW] | Reference |
|---|---|---|---|---|
| Bacillus cereus RCL 02 | sugarcane molasses | P(3HB-co-3HV) | 85.2 | this study |
| Burkholderia glumae MA13 | sugarcane molasses | P(3HB-co-3HV) | 46.6 | de Paula et al., 2021 |
| Burkholderia sp. ISTR5 | p-coumaric acid and molasses | P(3HB-co-3HV) | 83 | Morya et al., 2021 |
| Cupriavidus necator ATCC 17699 | vinasses–molasses mixture | P(3HB-co-3HV) | 78 | García et al., 2019 |
| Cupriavidus necator H16 (Re 2058/pCB113) | date seed oil and date molasses | P(3HB-co-3HHx) | 51 | Purama et al., 2018 |
| Pseudomonas mendocina CH50 | sugarcane molasses | P(3HO-co-3HD) | 14.2 | Basnett et al., 2020 |
| Recombinant Ralstonia eutropha | sugarcane molasses | P(3HB-co-LA) | 29.1 | Jo et al., 2021 |
Although PHA accumulation by endophytic B. cereus strains was not previously analyzed in detail, the potential of nonendophytic strains of B. cereus to produce the biopolymer has been extensively documented (Valappil et al., 2007; Akaraonye et al., 2011; Sharma and Bajaj, 2015; Mohandas et al. 2018; Evangeline and Sridharan, 2019; Suryawanshi et al., 2020). The bacterium B. cereus SPV was found to produce the homopolymer P(3HB), accounting for 38% of its DCW, using glucose as the main source of carbon (Valappil et al., 2007). However, P(3HB) production by the strain SPV was enhanced up to 61.07% DCW when the growth medium was supplemented with sugarcane molasses (Akaraonye et al., 2011). Similarly, Sharma and Bajaj (2015) isolated the bacterium B. cereus PS 10 from a domestic waste landfill, which exhibited a substantial P(3HB)-producing potential (57.5% DCW) with the use of sugarcane molasses. In the study by Mohandas et al. (2018), the marine water isolate B. cereus MCCB 281 and glycerol were used for the production of copolymers of PHA. In the present study, the central composite design-based statistical optimization enhanced the MCCB 281-mediated PHA production [68.27% (w/w)] by 1.5-fold. Likewise, Plackett–Burman and central composite design of RSM were used for the optimization of the process parameters, viz. molasses, ammonium sulfate, and initial pH, with the maximum production of P(3HB) accounting for 40.3% DCW achieved from B. cereus strain VIT-SSR1 (Evangeline and Sridharan, 2019). Recently, Suryawanshi et al. (2020) also used BBD for enhancing the production of P(3HB) (59.30% DCW) by B. cereus 2156, using molasses and urea as carbon and nitrogen sources, respectively. Therefore, it is apparent that the production of PHA (85.2% DCW) by the endophytic isolate B. cereus RCL 02 was higher compared with other PHAproducing B. cereus strains so far reported.
NMR spectroscopic analysis
1H NMR was used to determine the monomeric composition of the purified PHA polymer isolated from the endophytic B. cereus RCL 02. The 1H NMR spectrum (Fig. 5) showed resonances at 1.25, 2.45–2.64, and 5.22–5.27 ppm representing the methyl (−CH3), methylene (−CH2−), and methine groups (−CH−), respectively, from the 3HB monomer. Likewise, the resonances at 0.89, 1.62, and 5.15–5.17 ppm represented the methyl group (−CH3), methylene group (−CH2−), and methine group (−CH−), respectively, corresponding to the 3HV monomer. The chemical shifts observed were consistent with the previous findings of Pillai et al. (2020) and confirmed that the polymer obtained from the endophytic isolate B. cereus RCL 02 was P(3HB-co-3HV).
Fig. 5
1H NMR spectra of purified P(3HB-co-3HV) copolymer produced by the endophytic isolate B. cereus RCL 02
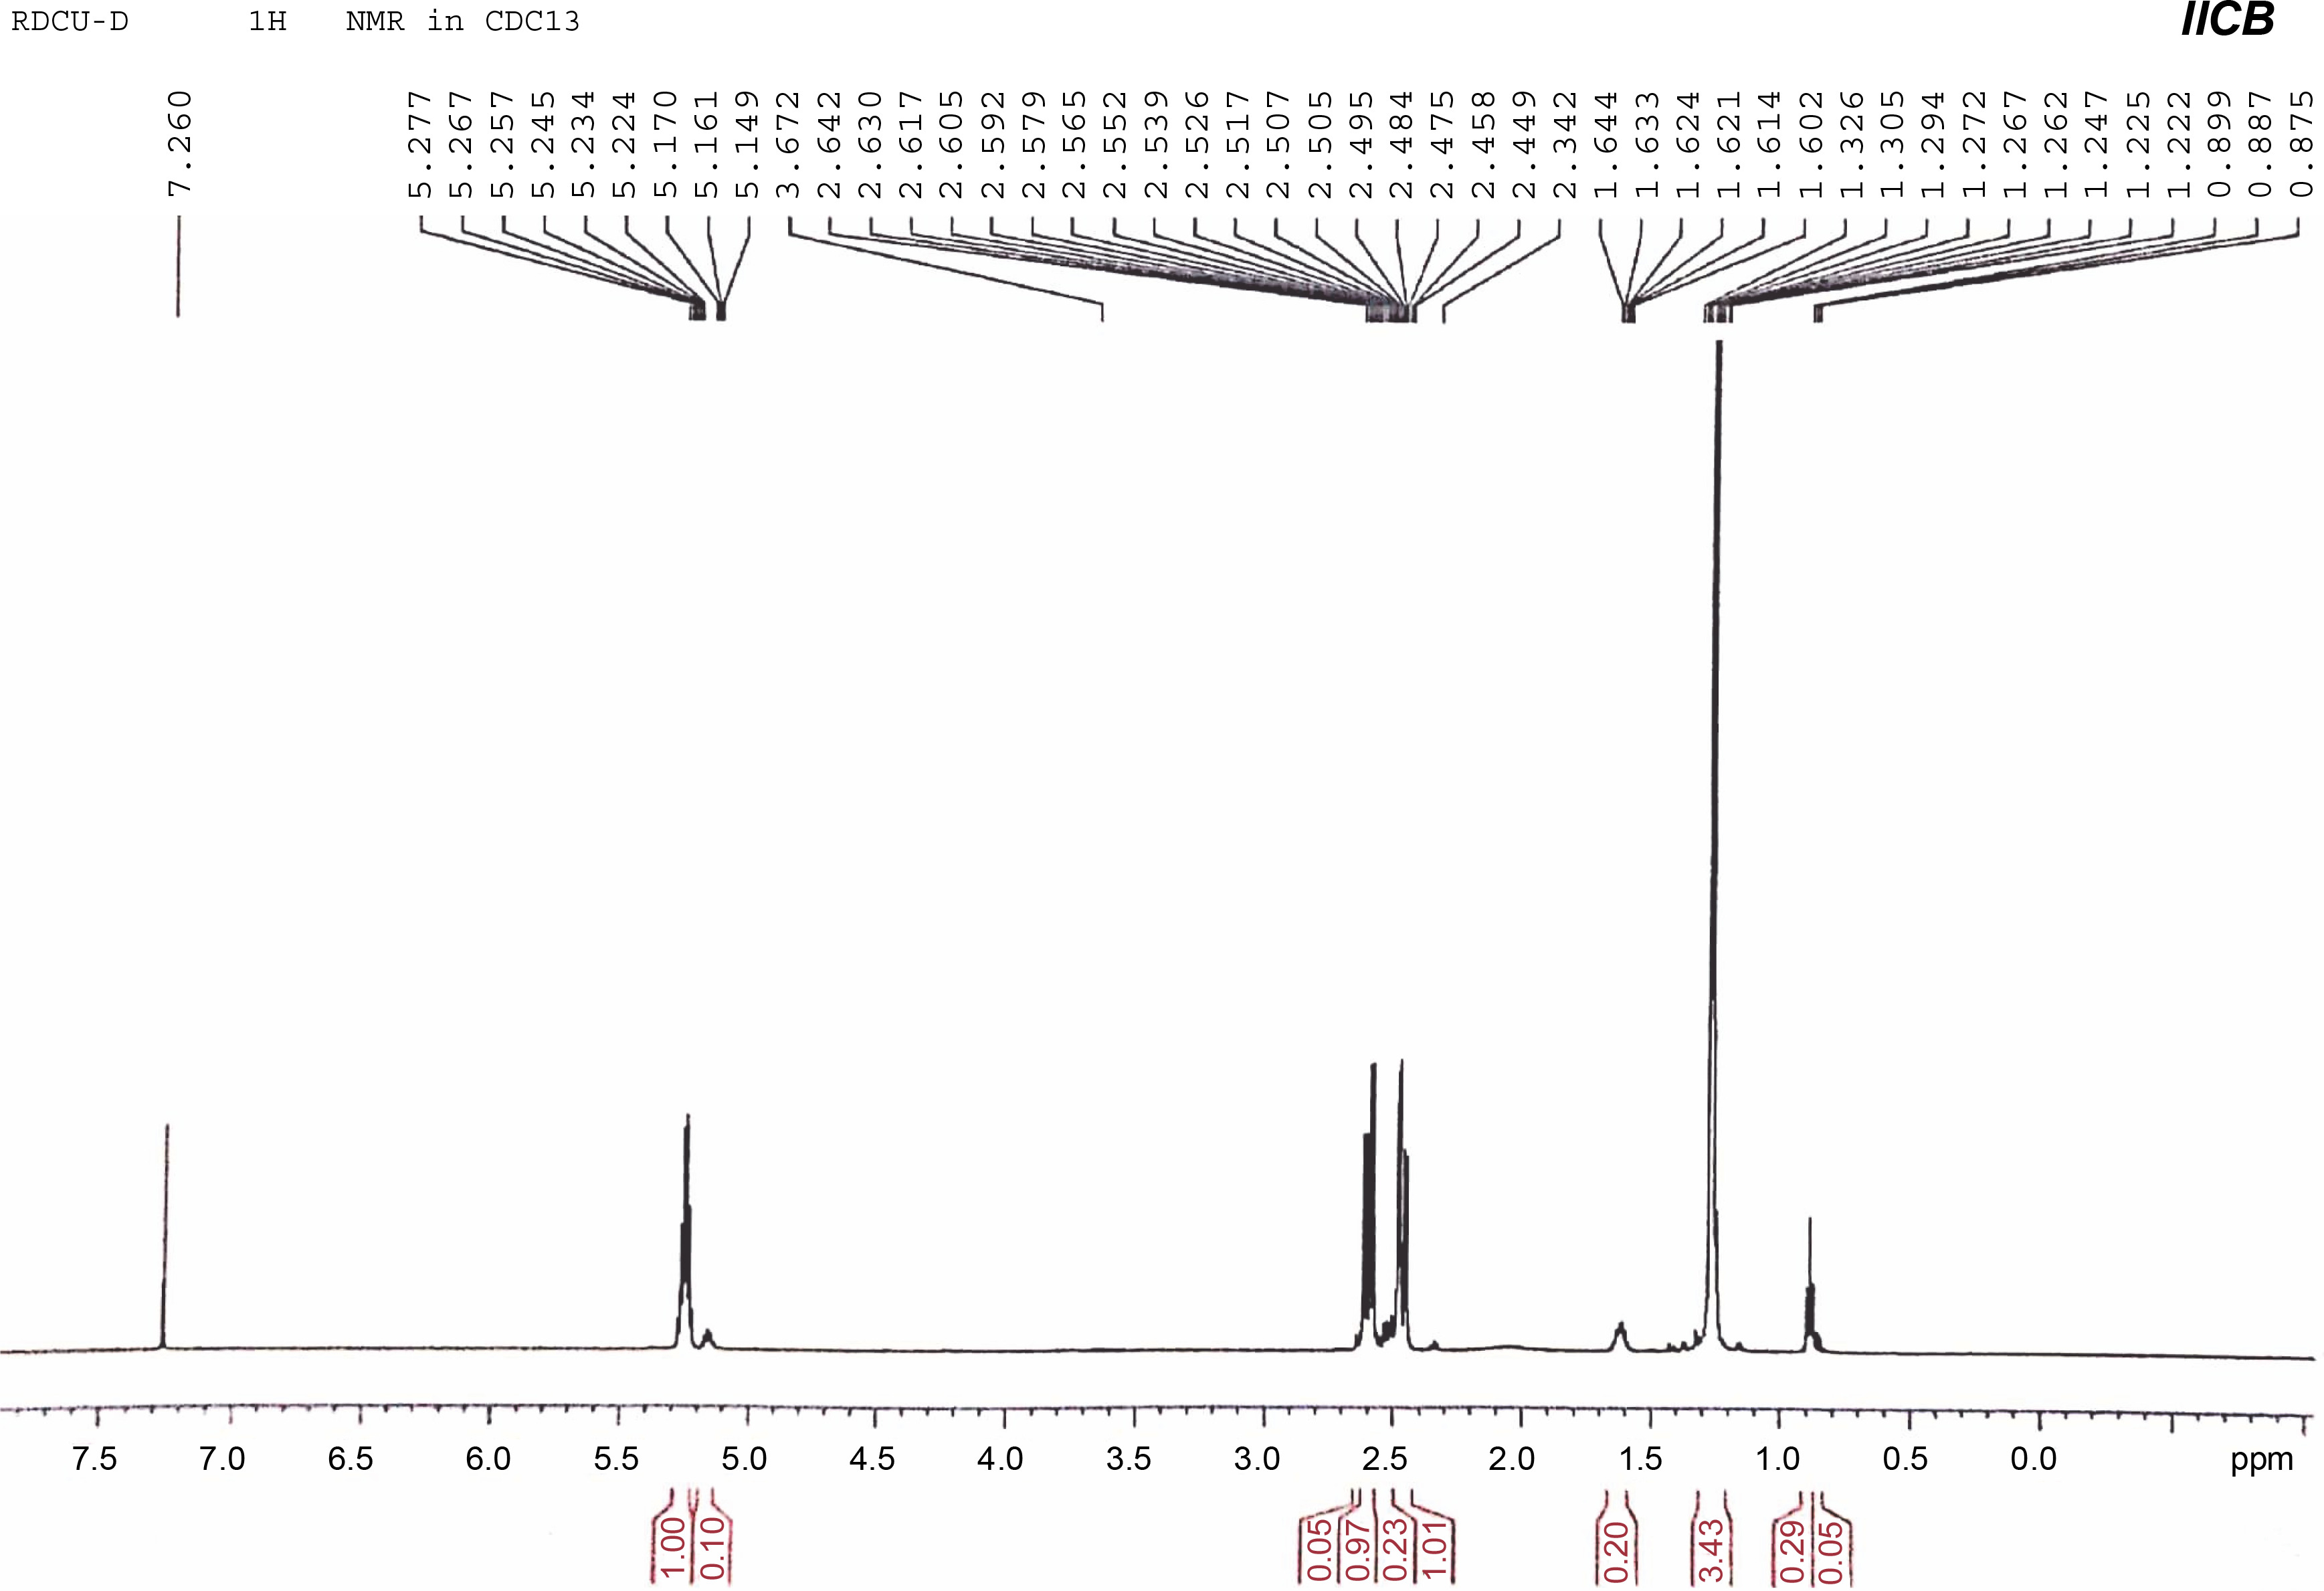
The characteristic peaks at 0.9 and 1.25 ppm in the 1H NMR spectrum are commonly used to determine the composition of 3HV in P(3HB-co-3HV), according to the following equation:
By integrating the area under the peaks at 0.89 and 1.25 ppm in the 1H NMR spectra, it was found that P(3HB-co-3HV) produced by B. cereus RCL 02 under optimized cultural conditions had 7.8 mol% 3HV.
Incorporation of the 3HV monomer (7.8 mol%) in P(3HB-co-3HV) by the endophytic strain RCL 02 was fairly notable when compared with other PHA copolymers accumulated by different bacterial strains after fermentation using molasses and related agro-industrial waste-based products as the carbon source. On the other hand, PHA accumulated by Burkholderia glumae MA13 had only 1.5 mol% 3HV using sugarcane molasses (de Paula et al., 2021), while the halophilic archeal strains, viz. Haloferax mediterranei and Halogeometricum borinquense, have been reported to accumulate P(3HB-co-3HV) with 12.36 mol% 3HV using pretreated vinasse (Bhattacharyya et al., 2012) and 13.29 mol% 3HV using pretreated sugarcane bagasse (Salgaonkar and Braganca, 2017), respectively. Furthermore, the bacterium B. cereus YB-4 isolated from ammunition-polluted soil accumulated PHAs with 3HV fraction up to 2 mol% using glucose as the sole source of carbon (Mizuno et al., 2010).
Feedstock plays an important role in determining the economic feasibility and sustainability of PHA bioprocessing (Sirohi et al., 2020). Previous reports have documented the exploitation of inexpensive and readily available sugarcane molasses as the carbon substrate for the production of the intracellular PHA polymer using a number of bacterial strains. The majority of these studies have reported the production of P(3HB) using molasses. Despite the biodegradability and biocompatibility of P(3HB), its widespread application is still limited due to its high crystallinity and brittleness (Raza et al., 2020). However, P(3HB-co-3HV) is considered more promising due to higher elasticity with lesser crystallinity and tensile strength and hence comparatively more flexible (Grigore et al., 2019). Supplementation of propionic acid, p-coumaric acid, and vinasses in sugarcane molasses has led to the production of P(3HB-co-3HV) copolymer by microbial cultures such as Azohydromonas lata (Zafar et al., 2012), Burkholderia sp. (Morya et al., 2021), and Cupriavidus necator (García et al., 2019). However, reports on the production of copolymers such as poly(3-hydroxybutyrate-co-3-hydroxyhexanoate), P(3HO-co-3HD), and P(3HB-co-LA) from sugarcane molasses by naturally occurring bacteria and recombinant strains are not uncommon (Purama et al., 2018; Basnett et al., 2020; Jo et al., 2021) (Table 7). The endophytic B. cereus RCL 02 could accumulate P(3HB-co-3HV) using molasses, without any pretreatment and supplementation of the fermentation medium with precursors. In general, the alkanoic acids used as precursors in the fermentation medium for the production of various heteropolymers are expensive and often exert an inhibitory effect on the growth of the producer organisms (Das et al., 2018). On the contrary, using agro-industrial wastes such as molasses as the carbon feedstock instead of a pure carbon source and expensive precursors for PHA production is not only a sustainable alternative in the disposal of industrial by-products but also favors the bioconversion of waste into an economically valuable product (Akaraonye et al., 2010). It is apparent that different acidic compounds produced as metabolic intermediates during the growth-associated utilization and fermentation of molasses by the strain RCL 02 might contribute to the incorporation of 3HV monomers into the accumulated PHA (Das et al., 2019). Furthermore, sugarcane molasses could not only serve as the potential source of carbon but also provide vitamins and other essential growth factors for the effective growth and sustainable production of P(3HB-co-3HV) copolymer by the bacterium B. cereus RCL 02.
A literature survey regarding the production of PHA by Bacillus spp. has clearly revealed that the accumulation of PHA, particularly by B. cereus strains, has been widely reported. However, the majority of the studies reported the production of the homopolymer P(3HB) (Evangeline and Sridharan, 2019; Suryawanshi et al., 2020), and only a few have documented the production of PHA copolymer with pretreatments of the carbon feedstock and/or supplementation with pure carbon sources and expensive precursors (Mizuno et al. 2010; Mohandas et al., 2018). The present study indicated the direct bioconversion of untreated AIBP to the PHA copolymer by an endophytic strain of B. cereus without any addition of precursor or cosubstrates to the fermentation medium, thus making the process environmentally and economically viable.
Conclusions
The study investigated the direct conversion of an inexpensive and renewable AIBP, sugarcane molasses, to P(3HB-co-3HV) copolymer by the endophytic isolate B. cereus RCL 02 without supplementation of any expensive precursors in the growth medium. To the best of our knowledge, this is the first report on statistical methodology-based agro-waste conversion to PHA copolymer with the 3HV monomer composition by an endophytic strain of B. cereus under single-step batch cultivation conditions. The BBD of RSM has been successfully implemented to optimize the process variables, in order to achieve the maximum PHA production and delineate the role of each of the variables and their interactive effects. The statistically designed optimization ensued a 1.6-fold increase in the PHA yield (7.8–12.6 g/l) by the isolate RCL 02 compared with the classical OVAT methodology. Bioconversion of raw sugarcane molasses to a substantial amount of PHA copolymer (12.6 g/l) by an endophytic bacterial strain appears to be enticing both economically and ecologically, as it has integrated the biosynthesis of PHA with simultaneous utilization of an AIBP. Future studies will focus on developing a suitable and energy-efficient downstream process for the sustainable production of this biogenic polymer. In addition, detailed physicochemical characterization of this accumulated P(3HB-co-3HV) copolymer would be carried out to identify its potential applications, particularly in biomedicine.