


Introduction
Commonly known as Indian Pennywort, Centella asiatica (Apiaceae) is an important medicinal and edible plant, primarily found in countries with tropical and subtropical climates (Singh et al., 2010). It is chiefly used as an herbal remedy and vegetable in Asian countries such as India and Sri Lanka (Prasad et al., 2016). Fresh leaves of C. asiatica are used in salad preparations, as vegetables, and as juice, whereas its dried leaves are used for making tea decoctions and infusions (Hashim, 2011; James and Dubery, 2009). Centella asiatica exhibits several medicinal characteristics such as antistress, antianxiety, anticancer, antiulcer, antibacterial, and anti-inflammatory properties (Puttarak and Panichayupakaranant, 2012; Abas et al., 2013). Its pharmacological effects can be attributed to biochemical components, such as triterpenoids, flavonoids, and volatile oils (Seevaratnam et al., 2012).
The process of drying enhances the shelf-life of C. asiatica leaves and makes further processing easier; therefore, in the pharmaceutical industry, its leaves are dried before being used (Niamnuy et al., 2013). Drying is a preliminary food preservation technique that eliminates water in a product to a level that inhibits the growth of microorganisms, thus increasing the shelf-life of perishable plant-based raw materials (Mahayothee et al., 2020). Moisture content can be a critical factor for ascertaining microbial safety during storage and consumption. Therefore, in the preservation of the shelf-life of crude herbs or food items, lowering the water activity is an important step (Kulshrestha et al., 2008). Moreover, drying minimizes packaging requirements by reducing the weight, thereby making storage and transport convenient (Kaur et al., 2020; Rahimmalek and Goli, 2013).
Before consumption or further processing, dehydrated vegetables need to be rehydrated (Oliveira and Ilincanu, 1999). Rehydration is a crucial step in the utilization of dried food products, especially in fruits and vegetables (Beaudry et al., 2004). The most desired properties of the rehydrated vegetables are their texture and flavor since consumers prefer a firmer texture of rehydrated products. Thus, improvement in texture has become an essential objective of dehydration (Tadesse et al., 2016). Some of the widely used drying treatment methods are solar, shade, oven, freeze, and microwave drying (MD). In recent years, freeze drying (FD) and MD have become popular drying methods for a wide range of herbal products (Wang and Sheng, 2006). FD retains the features that are closer to the innate appearance of the fresh plant and provides superior flavor, aroma, porosity, rehydration characteristics, and minimal shrinkage to the dried products (Venskutonis, 1997; Hamrouni-Sallami et al., 2013). In the case of MD, local pressure and temperature could be set as required, thus making it a rapid dehydration process (Cheng et al., 2006).
Currently, naturally occurring antioxidants found in food or herbal materials are of increased demand due to their wider acceptability (Roshanak et al., 2016). In the case of C. asiatica, the presence of triterpenes and high total phenolic content is responsible for its medicinal and nutraceutical applications (Seevaratnam et al., 2012). Although the effects of drying methods on the quality of C. asiatica have been reported in previous works, limited drying methods have been employed in these studies (Niamnuy et al., 2013; Trirattanapikul and Phoungchandang, 2014; Zainol et al., 2009). Moreover, the effects of shade, solar, and FD methods have not been assessed in these works. Furthermore, there is no systematic study evaluating the effects of drying techniques on the structural changes, color characteristics, rehydration ratio (RR), and water activity of dehydrated C. asiatica leaves. Thus, the objective of the present study is to compare the efficiency of five drying methods – viz. solar, shade, oven, freeze, and microwave – on the color characteristics, functional groups, antioxidant activity (2,2-diphenyl-1-picrylhydrazyl (DPPH), and 2,2-azino-bis-3-ethylbenzothiazoline-6-sulphonic acid (ABTS) assays), and retention of eight bioactive components (kaempferol, rutin, quercetin, madecassoside, madecassic acid, asiaticoside, asiatic acid, and chlorogenic acid) in dehydrated C. asiatica leaves.
Materials and methods
Plant material
Matured leaves of C. asiatica were collected from Bari, Jajpur District, Odisha, India, in February 2020. The plant material was verified by Prof. Pratap Chandra Panda, Taxonomist and voucher specimen (11374) have been deposited at the Herbarium of Centre for Biotechnology, Siksha ‘O’ Anusandhan (Deemed to be University) Bhubaneswar, Odisha. The leaves were divided into six equal parts containing three sets of 50 g each.
Chemicals and Reagents
Ortho-phosphoric acid, high-performance liquid chromatography (HPLC)-grade methnol, acetonitrile, and water were obtained from Merck Life Science Pvt. Ltd., Mumbai, India. Reference standards, including asiatic acid, asiaticoside, and madecassoside of purity > 95%, were purchased from Natural Remedies Pvt. Ltd., Bangalore, India. Madecassic acid was purchased from Chromadex, USA. Kaempferol, rutin, chlorogenic acid, and quercetin were obtained from Cayman Chemical Company, Ann Arbor, Michigan, USA.
Drying methods
In solar drying (SD), a cabinet solar dryer supported with a solar panel was utilized. Leaves were placed on an aluminum-coated perforated tray covered with a UV-stabilized transparent polyethylene sheet to a height of 2 m, creating a drying chamber. Fans were directly coupled to a photovoltaic module with 50 W. In shade drying (SHD), leaves were placed inside a desiccator at room temperature (25°C) for 7 days. In oven drying (OD), leaves were kept in a ventilated oven at 60°C and weighed every 1 h until a constant weight was obtained. For MD, leaves were kept in a domestic digital microwave oven (Samsung) at 1200 W and weighed every 2 min until a constant weight was obtained. In the case of FD, the leaf samples were kept at −20°C for 24 h before being transferred to a freeze drier (Scan Vac Cool Safe freeze dryer, Labogene, Denmark). The leaf samples were dried by setting the condenser at −40°C and lowering the rotary pump pressure to 2 mbar. Dehydrated leaves were weighed every 2 h until a constant weight was obtained. After drying, the leaf pieces were ground using a grinder and passed through a 40 ASTME11 (425 μm) mesh sieve (Gilson Company, Inc., Lewis Center, OH) to obtain a fine powder.
Measurement of moisture content, water activity, and rehydration capacity
The moisture content of the leaf samples was measured in triplicate by weighing them periodically using a digital balance until a constant weight was achieved (with 0.01g accuracy), and the instantaneous moisture content (M) of the dehydrated samples was measured using Eq. (1):
Where Wo and Wd are the mass (g) of the fresh and dry matter of C. asiatica leaves, respectively.
Using a portable water activity meter (WA-60A) with a precision of ± 0.001, the water activity (aw) of the dried C. asiatica samples was evaluated at 25°C. Rehydration was carried out by adding 10 g of dried leaf samples to a beaker containing 100 ml of distilled water, and the mixture was maintained for 5 h. Rehydration temperature was kept constant using a water bath. Then, the excess water was drained and removed using an absorbent paper. The sample was weighed, and RR was calculated using Eq. (2). RR is expressed as the ratio of the water absorbed by the dried leaf sample (Wr) to the weight of the original leaf sample (Wd).
Each experiment was performed in triplicate.
Color measurements
The C. asiatica leaf samples dried using the five drying methods were powdered and kept in Petri dishes, and their color value was measured using a colorimeter (Hunter Lab Color Flex 150 Hunter Associates Inc., USA) according to the International Commission on Illumination parameters, i.e., L *, a *, and b *. The colorimeter was calibrated using a standard white surface (L = 96.12, a = −0.13, b = −0.30) before it was used to measure the color value. Values of the three color coordinates, i.e., lightness index (L *), red-green index (a *), and yellow-blue index (b *), were utilized to measure the whiteness value of the samples, ranging from black (0) to white (100), red (+a *) and green (−a *), and yellow (+b *) and blue (−b *). Color changes of the fresh samples (ΔE) were calculated using Eq. (3) (Tian et al., 2016):
where “0” refers to the color reading of the fresh samples (control). The larger the ΔE, the greater the color changes from the reference color. Each experiment was carried out in triplicate.
Quantification of bioactive compound content by HPLC analysis
HPLC analysis was carried out using a Shimadzu HPLC system (Shimadzu, Kyoto, Japan). The system consisted of the following components: a rheodyne injector, a CBA-20A controller, a CT0-20AC column oven, two LC-20AD pumps, and an SPD 20 diode array detector. The conditions of the HPLC experiment were followed as reported in an earlier study (Mohapatra et al., 2021). For the eight reference standards (asiatic acid, asiaticoside, madecassoside, madecassic acid, kaempferol, rutin, chlorogenic acid, and quercetin), stock solutions were prepared. Each reference standard was weighed individually and dissolved in methanol, and the final concentration of the stock solution was maintained at 1 mg/ml. The stock solution was then diluted 2, 4, 6, 8, and 10 times to prepare the calibration curve. The concentration of all the samples prepared was 25 mg/ml.
Fourier transform infrared spectroscopy (FTIR) analysis
For dried and ground leaf samples, FTIR spectra were obtained by following the method of Ordóñez and Rupérez (2011) using a JASCO FTIR spectrophotometer (FTIR-4600) equipped with a universal attenuated total reflectance sampling device containing a diamond crystal. An additional accessory plate with a conic awl was used, which required only a few milligrams (5 mg) of the sample without any previous treatment. Spectra were obtained at room temperature in the transmission mode over the wave number range of 349–7800 cm-1, with a scan speed of 2 mm/s and 32 accumulations at a resolution of 4 cm-1. Each sample was measured in triplicate, and the values were averaged to obtain average spectra. To remove the residues of the previous samples, the crystal was appropriately cleaned with methyl alcohol after each measurement, and a background spectrum study was carried out to compensate for atmospheric changes.
Determination of antioxidant activity
DPPH assay
For all the samples, the antioxidant activity was assessed by the DPPH free radical-scavenging ability, according to the protocol of Ray et al. (2019) with slight modifications. One milliliter of a methanolic solution of DPPH (0.1 mM) was mixed with 1 ml of various concentrations (5–200 μg/ml) of extracts, and the mixture was kept at room temperature for 30 min. The absorbance of the samples was measured at 517 nm using a ThermoFisher evolution 220 UV-Visible spectrophotometer. The mixture containing methanol and DPPH without the sample was used as the blank. The percentage inhibition of DPPH free radicals was calculated using the following formula:
The experiments were carried out in triplicate. The results were presented as the mean ± SD of three measurements, and the IC50 (half maximal inhibitory concentration) value was calculated from the scatter plot by taking the concentration of the sample on the x-axis and the percentage of inhibition on the y-axis. The IC50 value was then estimated using the fitted line, i.e., Y = a × X + + b, IC50 = (0.5 − b ) /a. The percentage of inhibition plotted in the scatter plot was the mean ± SD of three measurements.
ABTS assay
Using the ABTS method, the antioxidant capacity of all the samples was assessed following the protocol of Jena et al. (2017) with some modifications. The ABTS solution was prepared by mixing 7 mM ABTS solution with 2.45 mM ammonium persulfate, and then the mixture was kept at 37°C in dark for 16 h. Before the experiments, the prepared ABTS solution was diluted with methanol until an optical density of 0.70 ± 0.02 at 745 nm was achieved. One milliliter of different concentrations of extracts was mixed with 1 ml of ABTS solution. The mixture of methanol and ABTS without the sample was used as the blank. The percentage inhibition of ABTS free radicals was calculated using the following formula:
The experiments were carried out in triplicate. The results were presented as the mean ± SD of three measurements, and the IC50 value was calculated from the scatter plot by taking the concentration of the sample on the x-axis and the percentage of inhibition on the y-axis. The IC50 value was then estimated using the fitted line, i.e., Y = a × X + b, IC50 = (0.5 − b) /a. The percentage of inhibition plotted in the scatter plot was the mean ± SD of three replicate measurements.
Statistical analysis
All five drying experiments were conducted in triplicate, and the obtained values were represented as mean ± SD. To analyze the significant difference (P < 0.05) between the different drying treatments, one-way analysis of variance, a statistical model followed by Tukey’s multiple comparison post-test, was performed using Minitab 17 software (Minitab Inc., State College, PA, USA).
Results and discussion
The effects of drying techniques on the moisture content, water activity, rehydration, color characteristics, bioactive content, and antioxidant potential of C. asiatica are crucial for the quality of the product and better preservation. In this study, five different drying methods for obtaining C. asiatica powder were evaluated, and various characteristics that are involved in producing quality products were studied.
Effect of drying treatments on the moisture content of C. asiatica
The moisture content of fresh C. asiatica leaves without drying on a wet basis was 86.6%. The drying time and moisture contents of the leaf samples that underwent different drying methods are given in Table 1. From the results, it was evident that the drying time and the drying method influenced the moisture content of C. asiatica. The moisture content of the dried leaves was less than 5%, except for the samples that underwent SHD. The fastest drying was observed for MD (0.1h), whereas the longest was reported for SHD (168 h). In MD, electromagnetic energy was directly transformed into molecular kinetic energy, allowing heat to be generated within the material, which influences the water evaporability from the leaves (Atungulu et al., 2019). The evaporation of water within the sample was fastened by the absorption of microwave energy by the water molecules (Giri and Prasad, 2007). MD was found to be the fastest drying method for Phyllanthus amarus (Nguyen et al., 2015) and Murraya koenigii (Shivanna and Subban, 2014). Though faster, MD is not preferred since nonuniformity of the electromagnetic field creates hot spots, thereby resulting in poor quality of the dried products (Therdthai and Zhou, 2009). SHD and FD samples showed the maximum and the minimum moisture contents (5.4% and 2.4%, respectively). The rate of heat transfer into the food was found to be increased when exposed to high temperatures, thus resulting in the rapid removal of moisture (Lin et al., 2011). Similar findings were reported for Thymus daenensis (Rahimmalek et al., 2013).
Table 1
Effect of drying on moisture content, water activity and rehydration ratio of leaves of Centella asiatica
Effect of drying treatments on water activity and rehydration characteristics of C. asiatica powder
Water activity (aw) plays an important role in determining the quality of food (Bonazzi and Dumoulin, 2011). The main objective of the drying process is to decrease the aw values of perishable raw materials to < 0.5 and, in turn, to qualify them to be stored at ambient temperature (Bonazzi and Dumoulin, 2011). The aw values obtained for samples dried using different tested methods are shown in Table 1. All the drying methods showed aw values < 0.5. As reported in previous studies, an aw value < 0.7 indicates that the growth of yeast, bacteria, and molds is inhibited in the dried samples (Beaudry et al., 2004). In the present study, for C. asiatica leaf samples, the highest aw value of 0.48 was recorded for SHD, whereas the lowest aw value of 0.24 was obtained for FD. Consistent with these findings, lower aw values for FD samples were also reported in the literature for Thai curry leaves (Chaloeichitratham et al., 2018) and apple (Cichowska and Kowalski, 2018).
As shown in Table 1, the RR of freeze-dried C. asiatica leaves was significantly higher (P < 0.05) than that of the leaves dried using other methods. In previous studies, FD has been reported to produce samples with higher rehydration capacity in comparison with other drying methods, as FD products are porous and have a non shrunken structure, which helps in improving the rehydration capacity (Beaudry et al., 2004). Similar results have been reported in the case of carrot slices (Rajkumar et al., 2017).
Effect of drying treatments on the color characteristics of dehydrated C. asiatica powder
As mentioned previously, the color of the fresh and dried C. asiatica leaves was measured in terms of the Hunter L *, a *, and b * values, which is presented in Table 2. To quantify the potential color change of leaf samples processed by different drying techniques, color difference (ΔE ) was measured. The ideal color of the dried samples is achieved when their ΔE value is closer to that of the fresh leaves (0). For the five drying methods studied, significant differences in L *, a *, and b * values at P -value < 0.05 were observed. Lower values of L * (48.83 ± 0.95 d – 54.25 ± 0.63 a), a * (−1.02 ± 0.16 f – + 7.14 ± 0.26 b), and b * (10.44 ± 0.10 e – 21.74 ± 0.30 b) were reported for the dried C. asiatica leaves compared with the fresh samples, L * (54.63 ± 0.42 a), a * (−8.80 ± 0.70 a) and b * (24.69 ± 0.32 a). Leaves that underwent FD and SHD showed the highest L * value (54.25 ± 0.63a and 50.36 ± 0.19b, respectively). As mentioned in a previous study, higher L * values are preferred in the case of dried food products (Doymaz et al., 2006). OD- and SD-treated leaves showed the lowest L * values (49.98 ± ± 0.35 c and 48.83 ± 0.95 d, respectively). Arslan and Ozcan (2008) have reported that high temperatures and lengthy drying times are responsible for color degradation during drying. Furthermore, Roshanak et al. (2016) have found that high temperatures and lengthy drying times result in color degradation in the case of Camellia sinensis. In the present study, fresh samples showed the highest a * value (−8.80 ± 0.70 a), followed by FD-treated samples (−7.14 ± 0.26 b), whereas OD-treated samples showed the lowest value (−1.02 ± 0.16 f). According to the study of Arslan and Ozcan (2011), the a * values of OD-treated samples were lower than those of MD-treated and sun-dried samples in the case of red-bell pepper. Studies available in the literature show that intense browning reactions (Maillard) are the main cause of color degradation during drying (Adam et al., 2000; Salehi and Kashaninejad, 2018; Yan et al., 2019). It has also been reported that chlorophyll degradation in leaf cells owing to high temperature might be another reason for the loss of green color (Rahimmalek and Goli, 2013). In the present study, the minimum color change (ΔE ) (4.23 ± 0.07 e) and high lightness (L *) (54.25 ± 0.63 a) were observed for FD, suggesting that FD is suitable for obtaining high-quality C. asiatica dried leaves.
Table 2
Effect of drying methods on color characteristics of Centella asiatica
HPLC analysis of bioactive component content after drying
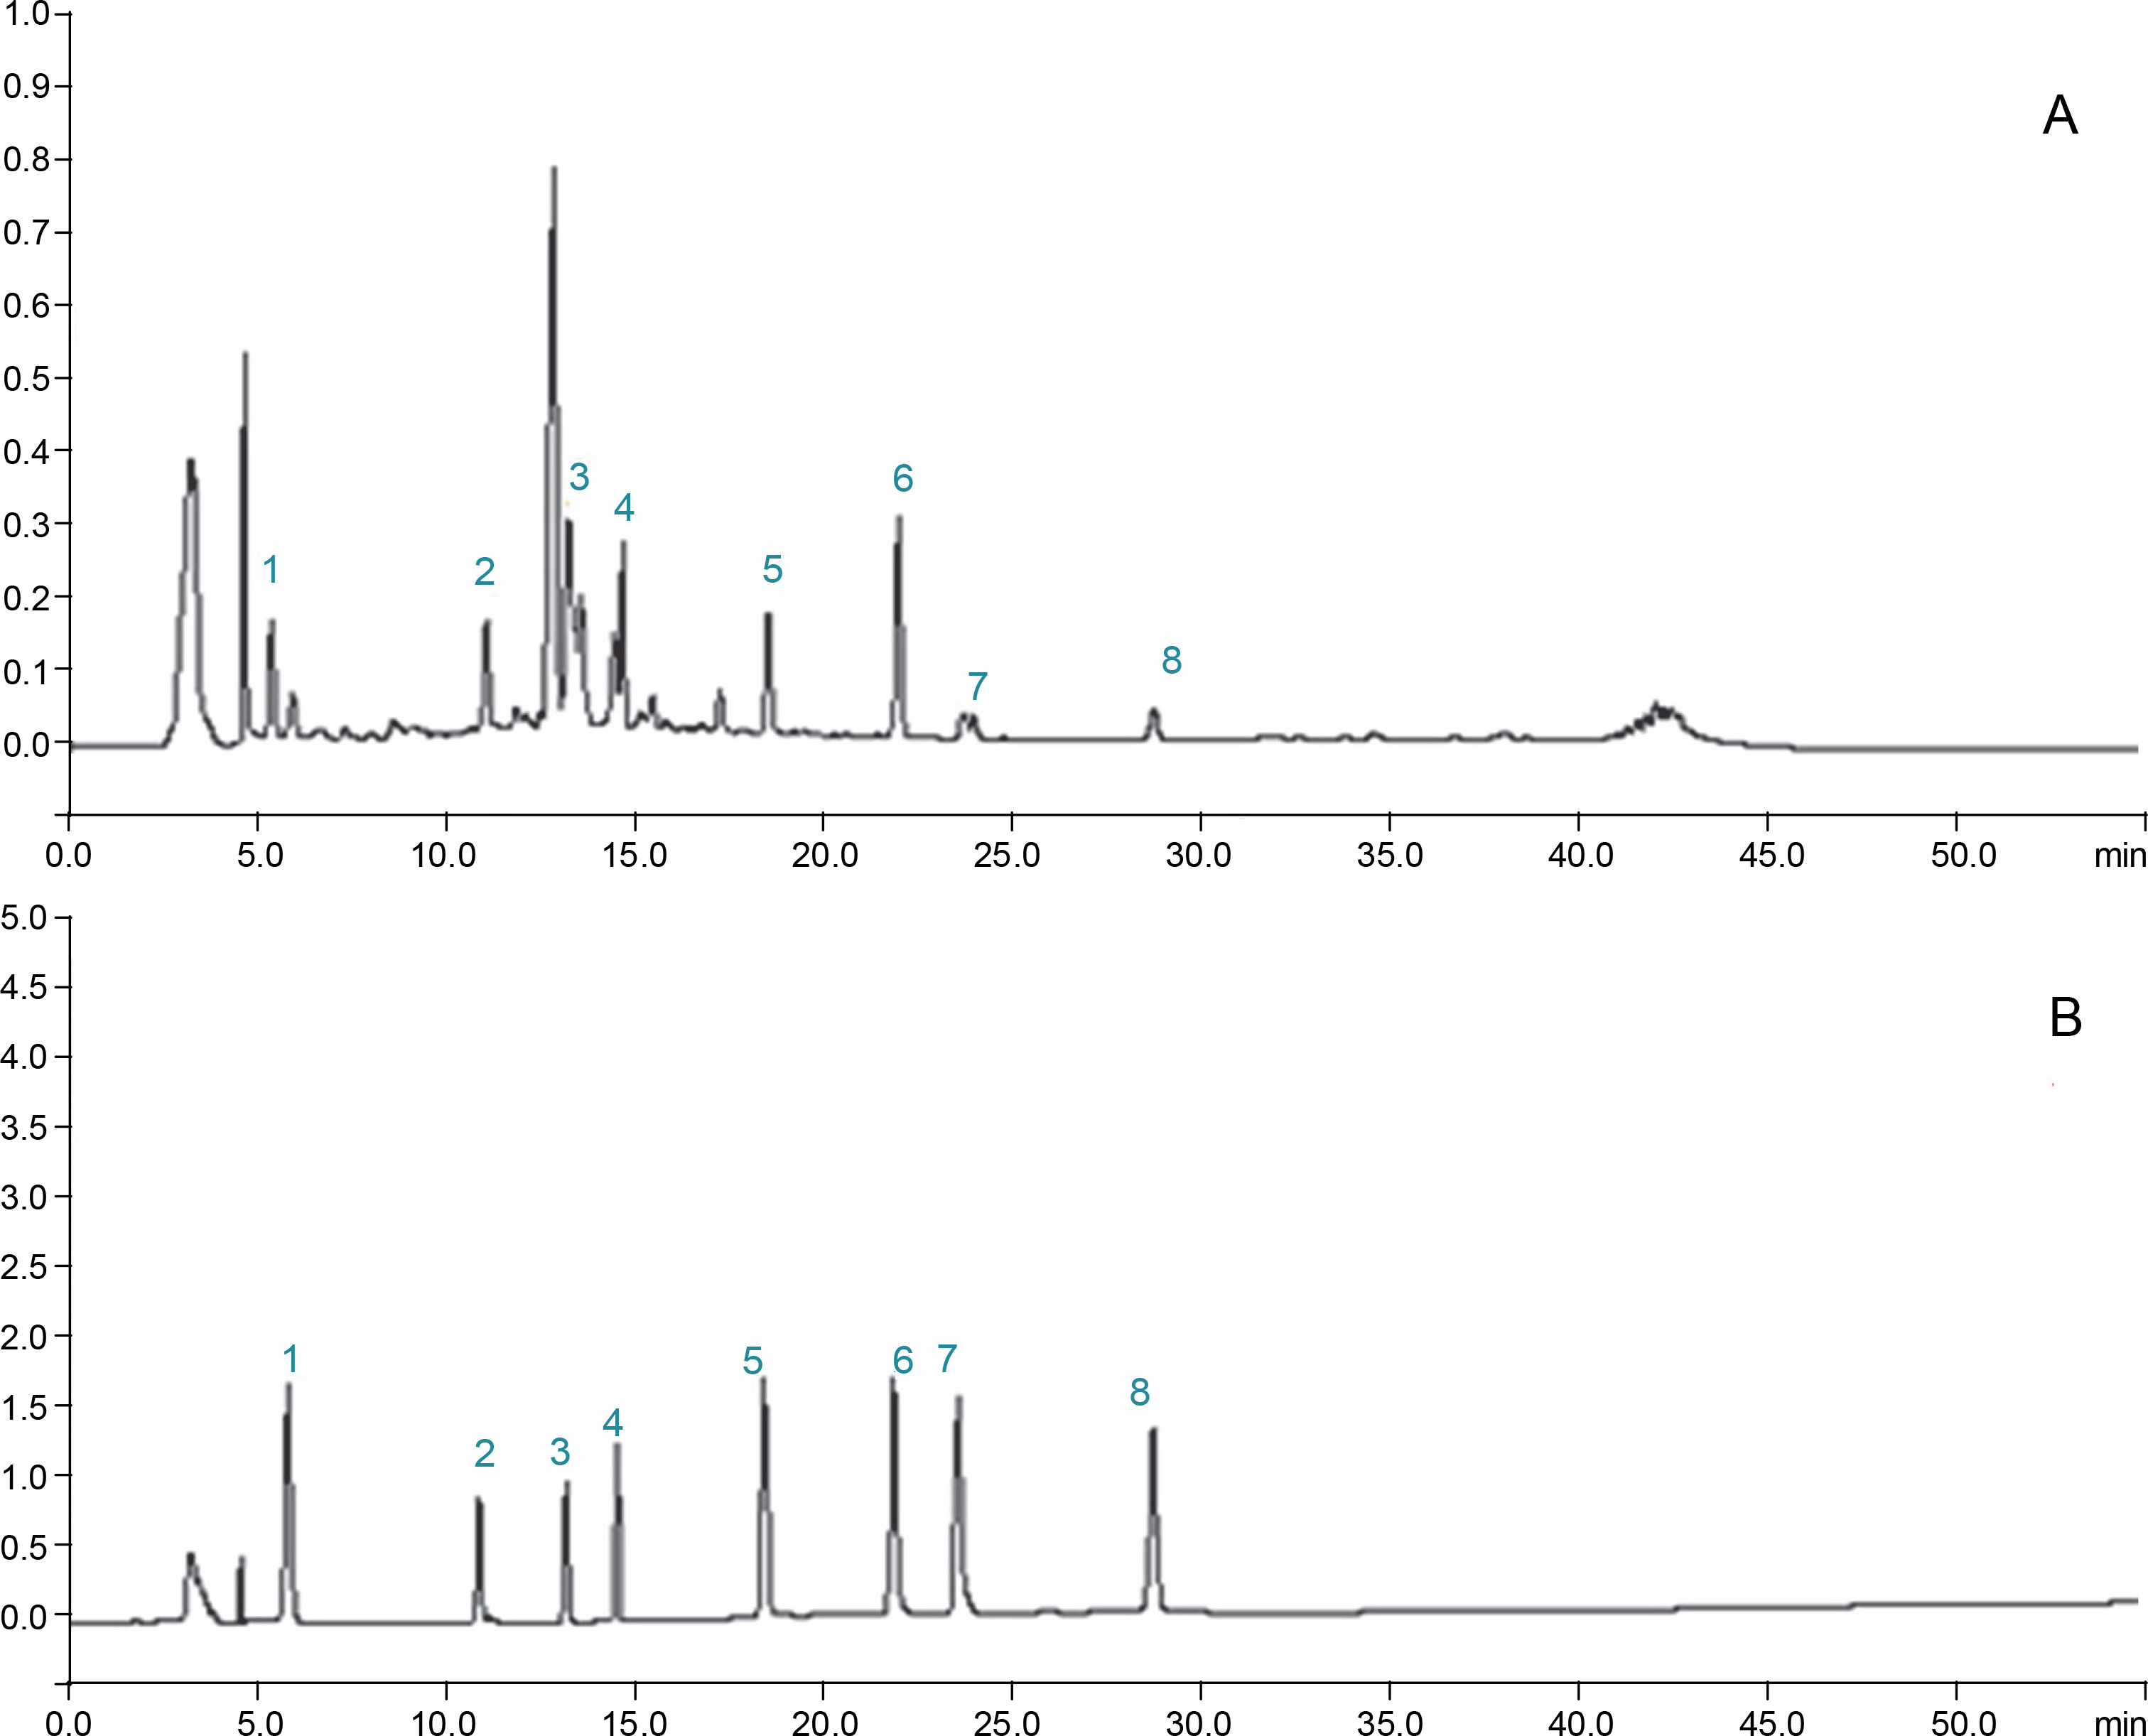
Different drying methods resulted in different compositions of bioactive compounds in the dried C. asiatica leaf samples. The contents of quercetin (0.33 ± 0.03 mg/g), kaempferol (0.90 ± 0.04 mg/g), chlorogenic acid (5.4 ± ± 0.03 mg/g), rutin (1.2 ± 0.04 mg/g), madecassoside (4.40 ± 0.09 mg/g), madecassic acid (7.7 ± 0.1 mg/g), asiaticoside (36.2 ± 0.11 mg/g), asiatic acid (31.63 ± ± 0.05 mg/g) in fresh C. asiatica leaves were higher than those in the dried leaves. The contents of these compounds were determined using HPLC by comparing their retention times with the reference standards. The lower values in the dried samples indicated that drying resulted in the degradation of triterpenes and flavonoids under the conditions of heating, oxygen, or freezing (Zainol et al., 2009; Niamnuy et al., 2013). Among the different drying methods studied, FD was found to be the best as it allowed the highest retention of centellosides, namely madecassoside (4.98 ± 0.09 mg/g), madecassic acid (6.65 ± 0.08 mg/g), asiaticoside (32.78 ± ± 0.06 mg/g), asiatic acid (31.63 ± 0.05 mg/g), and phenols such as quercetin (0.28 ± 0.06 mg/g), kaempferol (0.73 ± 0.03 mg/g), chlorogenic acid (4.9 ± 0.34 mg/g), and rutin (0.98 ± 0.23 mg/g). These results are shown in Table 3. The HPLC chromatogram for each of these compounds obtained using FD is presented in Fig 1. In previous studies, FD has been proposed as an efficient drying method for obtaining high-quality vegetables and fruits (Huang et al., 2009; Do Thi and Hwang, 2016; Mbondo et al., 2018; Tan et al., 2020; Yan et al., 2019). FD is considered efficient as it may lead to the formation of ice crystals within the matrix, which may rupture the cell structure, releasing the bound compounds from the matrix (Tan et al., 2020). In the present study, OD and SD were found to be the least efficient drying methods. It was observed that with an increase in the drying temperature, the contents of glycoside (madecassoside and asiaticoside) and aglycone (madecassic acid and asiatic acid) decreased significantly. With increasing temperature, there is a possibility of hydrolysis of both the glycosides to their aglycones, which are further degraded at higher temperatures (Niamnuy et al., 2013). In addition, OD and SD resulted in the loss of phenolic compounds. This loss may be attributed to the high temperature and long duration, which affects the integrity of cell structure, resulting in the migration of the bioactive compounds by leakage (Davey et al., 2000; Schieber, 2001). Similar findings have been reported for tomato and ginger, where the FD method is found to be superior to the OD method in retaining bioactive contents (Gümüşay et al., 2015). The results of the present study are in agreement with the previously reported literature, where the loss of bioactive component contents and essential oils was reported in aromatic and medicinal plants dried at high temperatures (Díaz-Maroto et al., 2003; Hamrouni-Sellami et al., 2011; Yousif et al., 1999).
Table 3
Effect of drying methods on the bioactive compounds of Centella asiatica
Effect of drying treatments on the antioxidant potential of C. asiatica
The antioxidant capacity of fresh, oven, freeze, microwave, solar, and shade-dried leaf samples of C. asiatica was evaluated using DPPH and ABTS assays. As shown in Table 4, though both fresh and dried C. asiatica leaves showed antioxidant activity, fresh C. asiatica leaves showed significantly higher DPPH and ABTS values compared with the dried ones. The findings of the present study are in agreement with those of Do Thi and Hwang (2016), who reported that the drying process resulted in the loss of biologically active components present in raw plant materials. The DPPH and the ABTS scavenging activities in the leaf extracts of the drying treatments studied were of the following order: FD > SHD > MD > SD > OD. As reported in a previous study, a low IC50 value indicates a high free radical scavenging activity (Arora et al., 2018). The FD samples exhibited the highest DPPH (IC50 value 68.6 ± 0.16 μg/ml) and ABTS (IC50 value −53.37 ± 0.26 μg/ml) scavenging activity, whereas the OD samples exhibited the lowest DPPH (IC50115.49 ± 0.21 μg/ml) and ABTS (IC50102.32 ± ± 0.17 μg/ml) scavenging activity. IC50 values were higher for DPPH than for ABTS as the former detects primarily hydrophobic antioxidants, whereas the latter identifies the antioxidant potential of both hydrophilic and hydrophobic substances over a wider pH range (El-Maatiet al., 2016; Rafińska et al., 2019). A few other factors such as stereo selectivity of radicals and solubility of extracts can also affect the capacity to react and quench various radicals (El-Maatiet al., 2016). In the literature, the FD method was proposed to be better than other drying methods as it exhibited a less damaging effect on the tissue structure (Yousif et al., 1999). Seevaratnam et al. (2012) reported that the high total phenolic content in C. asiatica is attributable to the presence of quercetin, kaempferol, rutin, catechin, apigenin, and naringin. In the present study, the highest phenolic content was retained in the FD samples, which might be responsible for their high antioxidant activity. The high temperature in OD degrades the heat-sensitive nutrients and phytochemicals; therefore, it is not a desirable method for drying (Chan et al., 2009; Karaman et al., 2014). The findings of the present study are in agreement with the results of other authors, who have reported FD as the optimal drying method to obtain samples with maximum antioxidant activity (Do Thi and Hwang, 2016; Tan et al., 2020).
Table 4
Effect of drying on antioxidant potential on the antioxidant activity of Centella asiatica leaf
Effect of drying treatments on the functional characteristics of dehydrated C. asiatica powder
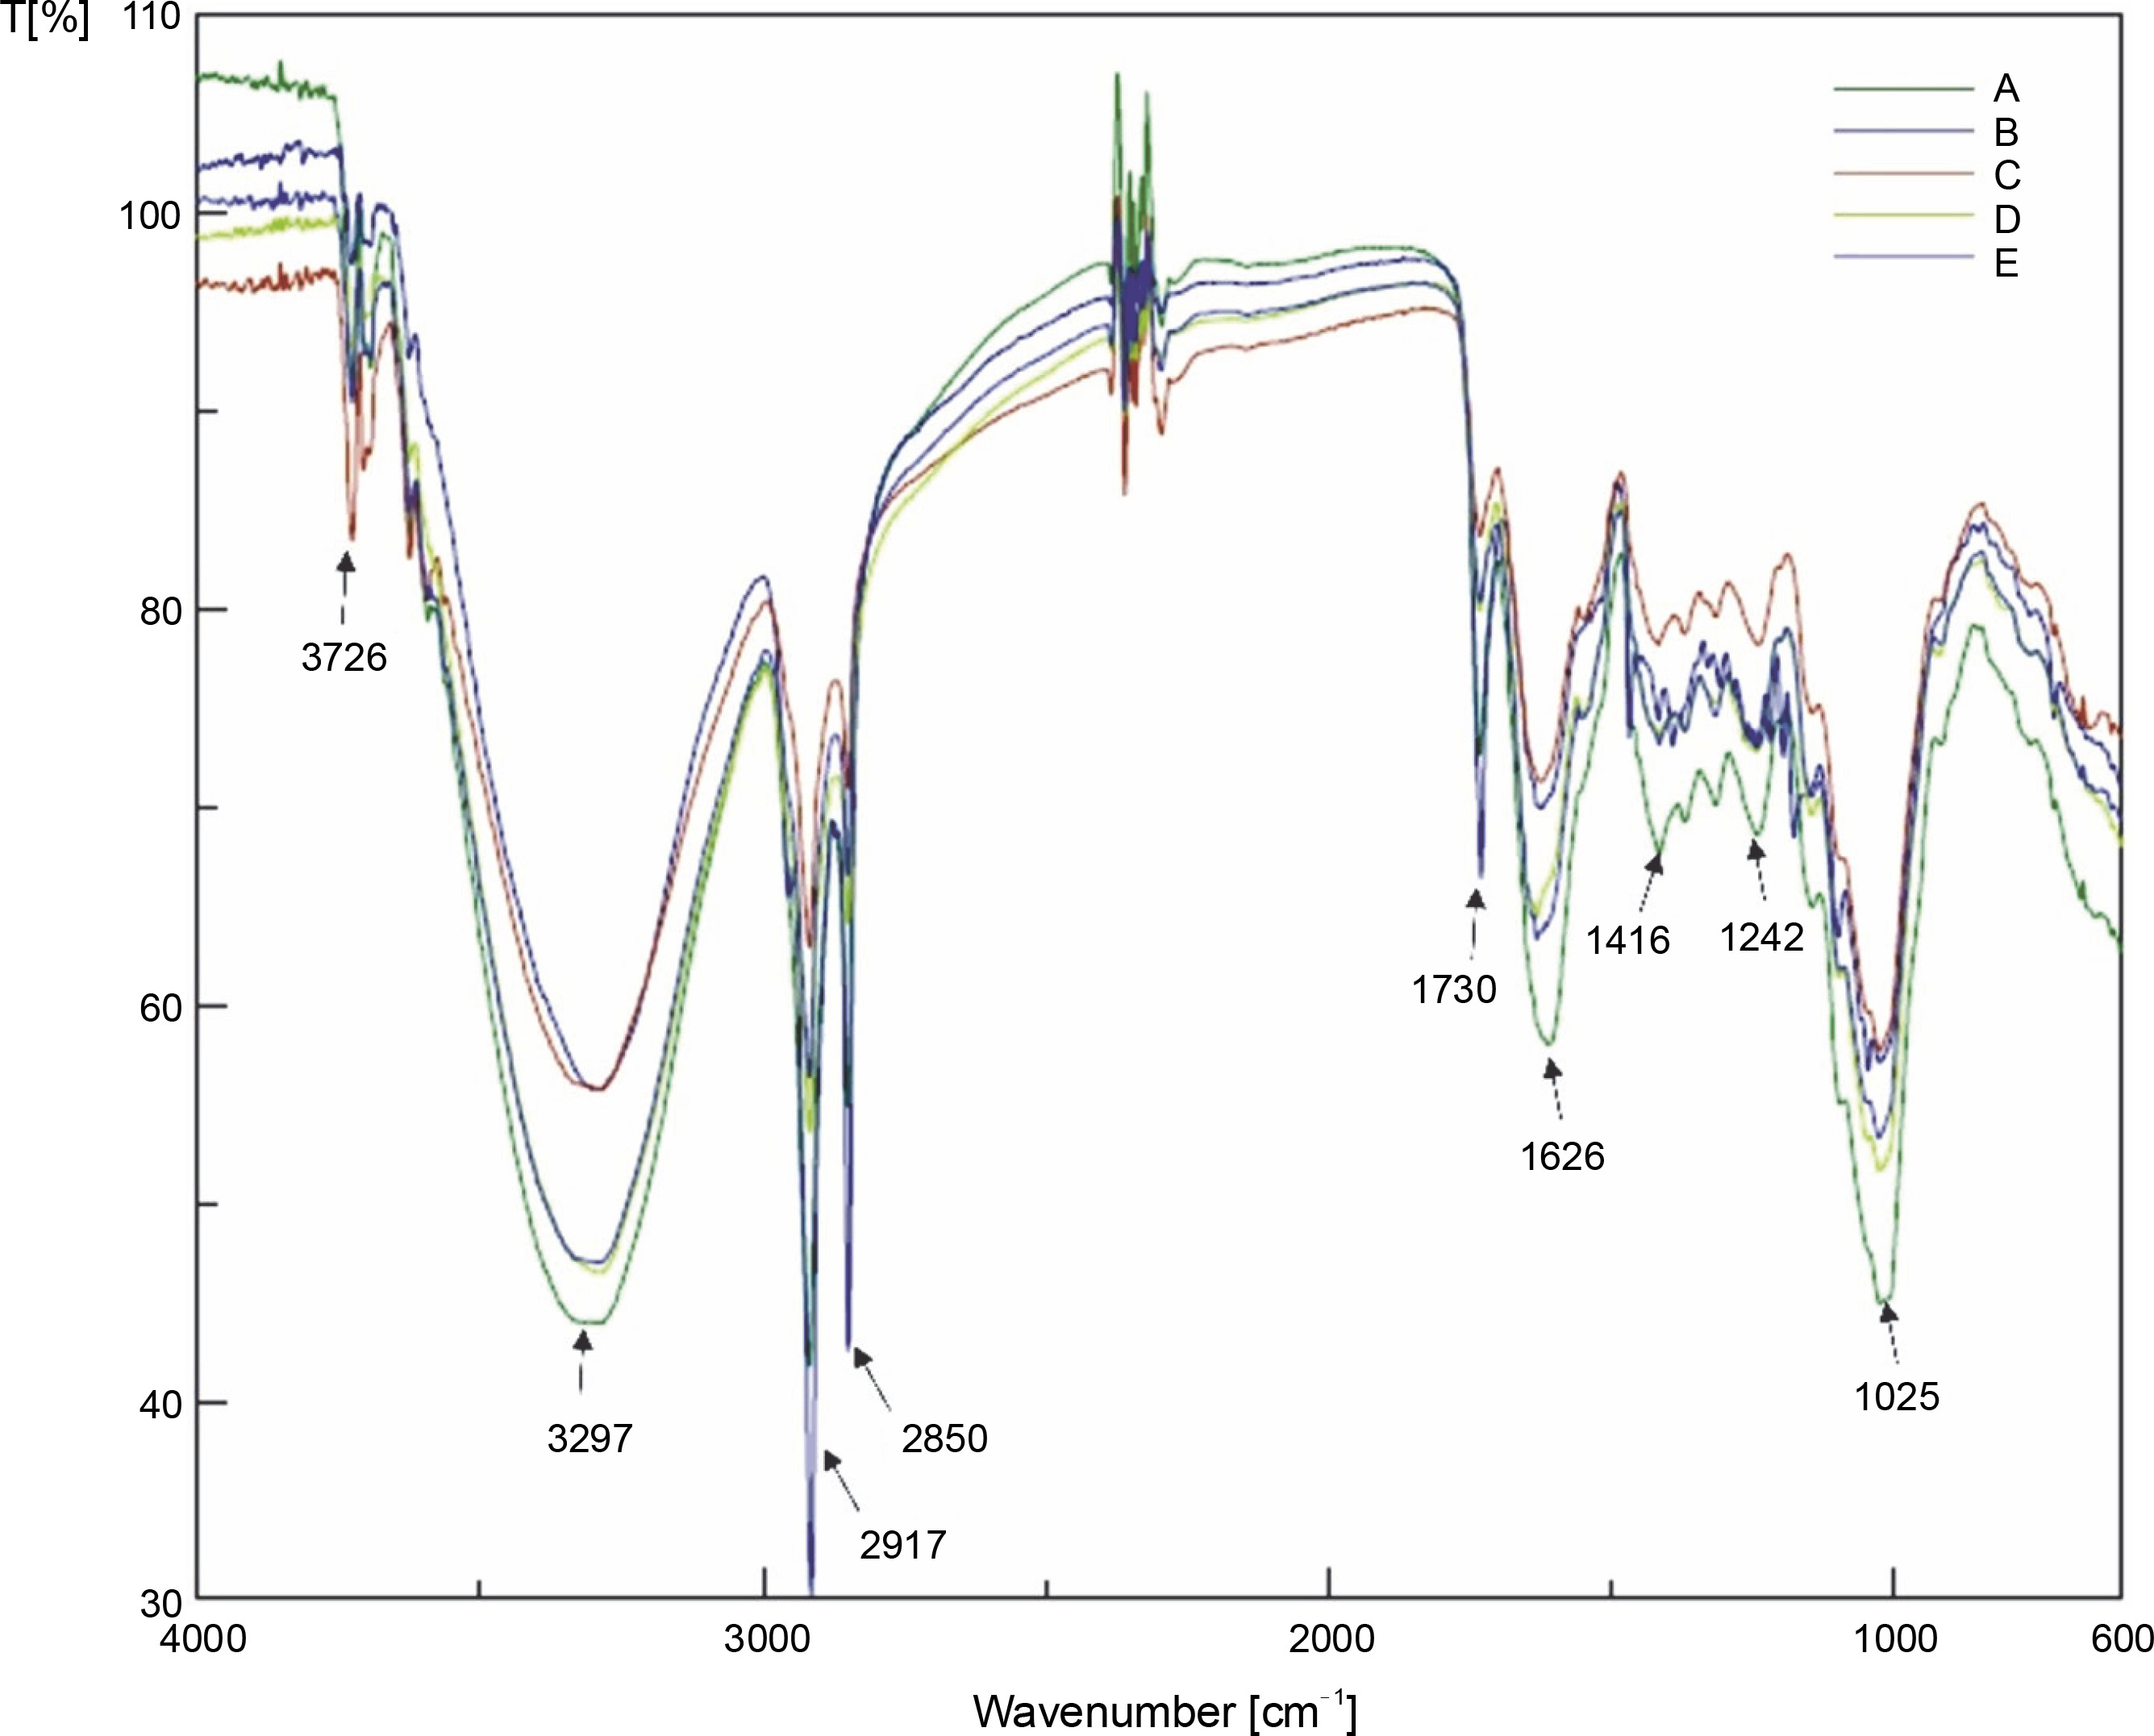
Among the five drying methods studied, no visible difference between the FTIR spectra of C. asiatica leaves was reported, indicating that no conformational changes occurred in the functional groups of the chemical constituents (Fig. 2). The band at wavenumber 3726 cm-1 was designated as the free OH stretching vibration of amide (Satapute et al., 2017). The absorption at wave number 3297cm-1 was associated with the N–H peak designated to chlorophylls (Petrovićet al., 2006). The intensity of the N–H band was the highest for the OD samples and lowest for the FD samples. This may indicate that the high temperature in OD resulted in a change in the chlorophyll structure, leading to the loss of central magnesium atoms. The color change observed from green to olive brown was often attributed to the loss of central magnesium atoms from the Mg–N bonds (Ngamwonglumlert et al., 2016). Absorptions at wave numbers 2917 cm-1 and 2850 cm-1 were generally designated to the C–H bond stretching of the methyl group (CH3) present in lipids and proteins (Rana et al., 2018). The band at wavenumber 1730 cm-1 was assigned to the C=O stretch of pectin, lignin, and hemicellulose (GómezOrdóñez et al., 2011). The absorption at wavenumber 1626 cm-1 was assigned to the C=C stretching of alkenes (Sugunabai et al., 2015). The absorption at wavenumber 1416 cm-1 was designated to alkenes with C–H bending vibrations (Sugunabai et al., 2015). The band with wavenumber 1242 cm-1 was attributed to the C=O stretching due to pectic substances, lignin, and hemicellulose (Topală and Rusea, 2018). The absorption wavenumber at 1025 cm-1 implied C–O and C–C stretching vibrations of the pyranose ring found in every polysaccharide (Gómez-Ordóñez et al., 2011). The FTIR peak near 1025 cm-1 (1022 cm-1) indicated starch crystallinity, and the intensity of the band increased with decreasing amorphous state (Pozo et al., 2018).
Conclusions
The present study demonstrated that the physicochemical properties, antioxidant potential, and bioactive retention of C. asiatica were significantly affected by the drying methods. Between the various drying methods studied, no major conformational changes were observed in the functional groups in C. asiatica leaves. OD and SD resulted in a decline in the total centelloside content (asiaticoside, madecassoside, asiatic acid, and madecassic acid) and the total phenolic content. Although the FD method required maximum duration to dry C. asiatica leaves, it showed the maximum color retention, lower water activity, higher bioactive content, and better antioxidant potential as compared to SD, SHD, OD, and MD. Therefore, FD can be considered as the optimal method for producing high-quality C. asiatica leaf powder.