


Introduction
In anaerobic digestion, biogas is produced when microorganisms decompose organic materials in the absence of oxygen (Onuoha et al., 2019). Biogas can be a clean and efficient fuel for numerous day-to-day applications such as cooking, electricity, transport, and other power applications (Prasad et al., 2017). It is considered a carbon dioxide-neutral biofuel, and when it is used as vehicle fuel, lower amounts of nitrogen oxide, hydrocarbon, and carbon monoxide are emitted compared with petrol or diesel (Rasi, 2009). Typically, biogas consists of the following: methane (65%), carbon dioxide (35%), and traces of hydrogen sulfide (H2S), ammonia (NH3), nitrogen, and hydrogen (Nkoi et al., 2018).
A large amount of waste is produced worldwide due to the increasing activities of the chicken farming and breeding industries (Jurgutis et al., 2020). In addition, agricultural activities contribute to 20% of global greenhouse gas emissions, one among which is chicken waste, where methane and nitrous oxide are the primary gases involved (Rajeni et al., 2016). Since chicken manure has a biodegradable organic fraction, it is suitable for anaerobic digestion (Dahunsi et al., 2016). Therefore, anaerobic digestion of chicken droppings is an important waste management approach, and it is necessary to explore ways of improving and utilizing the process.
Most of the biogas substrates, such as chicken droppings, contain lignocellulosic complexes that are resistant to decomposition (Montgomery and Bochmann, 2014). Hence, their utilization in renewable energy generation is limited (Dróżdż et al., 2020). Moreover, for chicken manure digestion, an adequate amount of water is needed (Jurgutis et al., 2020). These facts necessitate the study of the optimum ratio of the slurry for anaerobic digestion.
Pretreatment procedures are used to make the organic waste more accessible to anaerobic microbes (Baredar et al., 2016). To increase the availability of lignocellulosic materials for degradation, many pretreatment procedures have recently been developed (Montgomery and Bochmann, 2014). Physical/mechanical, chemical, biological, or combined methods are a few examples (Zou et al., 2016). However, there are some drawbacks in most of these methods. For instance, chemical pretreatment results in secondary pollution, biological pretreatment conditions are difficult to control, and combined pretreatment usually has the disadvantages of both chemical and biological methods (Zou et al., 2016). Ultrasonication is a new and effective mechanical pretreatment method used to improve the biodegradability of sludge (Pilli et al., 2011) or other substrates (Moison, 2012). It is a fast pretreatment method that increases insoluble microbial products as it solubilizes both intracellular and extracellular substances (Matobole et al., 2021). In ultrasonication, ultrasonic vibration waves are the primary cause of degradation. Ultrasonic sounds are the ones with a frequency higher than 20 kHz which is above the human auditory range (Moisan, 2012). The principle applied in ultrasonic pretreatment is to make the cell membranes dissolve through the cavitation process (Wu-Haan, 2010). To accelerate the ultrasonication process and minimize the cost of energy, Matobole et al. (2021) have recommended testing a range of sonication times until the optimum one is found.
Response surface methodology (RSM) is a mathematical technique used to develop a functional relationship between a response and its input variables, with an aim of obtaining an optimal response through a series of designed experiments (Maghsoudy et al., 2019). It plays an important role in process design and optimization, as well as in improving the performance of the system (Jose and Madhu, 2014) and experimental cost reduction (Liu and Wang, 2018). Using RSM, the number of experimental trials required to analyze numerous parameters and their interactions can be reduced (Abd Rahman, 2009). For optimization of the development of analytical procedures, central composite design (CCD) is more often utilized compared to other methods such as Box–Behnken and One Factor designs, as the latter are of low efficiency, especially because there are several variables (Chun et al., 2015). Using RSM, the present study aimed to achieve the optimum sonication time and slurry ratio for maximum biogas production from chicken droppings.
Materials and methods
Sample collection
The organic waste (chicken droppings) used in this study was collected in November 2019 from the Faculty of Agriculture farm, Bayero University, Kano, Nigeria (latitude 11.9742°N, longitude 8.4684°E), and stored in clean polythene bags. The organic waste was the inoculum and substrate used in this study and contained all the microbes essential for the anaerobic digestion process. The collected sample was immediately transported to the Microbiology Laboratory of the Centre for Biotechnology Research, Bayero University, Kano, Nigeria (latitude 11.9811°N, longitude 8.4802°E), for analysis.
Design of experiments
To design the experiments and optimize the variables (slurry ratio and sonication time), Design Expert® software, version 12.0.1.0 (Stat-Ease, 2018), was used. RSM was used for experimental modeling and analyzing the relationships between the input and the response variables, whereas analysis of variance (ANOVA) was used to analyze the regression coefficient, prediction equation, and case statistics. A 3D plot was prepared to study the effects of the variables individually and their interactions and to determine their optimum level. To optimize the levels of each variable for maximum response, numerical and point prediction methods were used.
To optimize the variables, Design Expert®, through CCD, makes use of lower and upper (− and +) level ranges of input values (Table 1) in order to generate a design matrix of 13 experimental runs (Table 2). The values were chosen based on previous studies that suggested 18 min of sonication (Karuppiah and Azariah, 2019) and a slurry ratio of 1:2 (Asikong et al., 2016) for biogas production. All the ratios of slurry used in the experimental design and presentation of results were converted to decimal form because the Design Expert software does not recognize ratios.
Table 1
Levels of variables input for the design of experiment
| Name | Unit | (−) level | (+) level |
|---|---|---|---|
| Sonication time | min | 5.00 | 25.00 |
| Slurry ratio | 0.50 (1.0 : 2.0) | 2.00 (2.0 : 1.0) |
Table 2
Central composite design matrix of the experiment
Using the inputs presented in Table 1, CCD generated a 2-factorial experimental design with eight non-center (four axial and four factorial) and five center points, leading to a total number of 13 experimental runs (Table 2). Each of these factorial design points had two levels, +1 and −1. Hence, for the two factors sonication time and slurry ratio, there were four design points: (−1, −1) corresponding to 5.00, 0.50 in run 10; (+1, −1) corresponding to 25.00, 0.50 in run 9; (−1, +1) corresponding to 5.00, 2.00 in run 5; and (+1, +1) corresponding to 25.00, 2.00 in run 13 (Table 2). Moreover, the five center points (runs 1, 3, 7, 11, and 12) were experimental runs whose values of each factor were the medians of that of the factorial points. The four axial points (runs 2, 4, 6, and 8) were experimental runs identical to the center points except for one factor, which had values both below and above the median of the two factorial levels and typically both outside their range. The difference in the values of sonication time and slurry ratio across the runs led to different responses (volume of biogas produced). Each experiment was conducted in triplicate, and the mean value of each experiment was used as the response in the design matrix.
Preparation of the slurry
Thirteen experimental runs with different ratios of slurry were conducted according to values in the design matrix (Table 2). Thus, for each experimental run, the ratio of chicken droppings (in kg) to distilled water (in l) was decided according to the corresponding values of slurry ratio given in Table 2.
Ultrasonic pretreatment of the organic waste
For each run, ultrasonic pretreatment was applied (according to sonication time in Table 2) using a Qsonica Q500 sonicator, equipped with a 3–16 μmp-p converter, a 3 : 1 gain booster, and a 2 : 1 gain probe of 2.54 cm diameter, operating at 20 kHz and an amplitude of 80 mm. The ultrasonication setting used in this study was based on previous experiments (Wu-Haan, 2010).
Anaerobic digestion
The experiment was conducted in batches, using unstirred laboratory-scale reactors (digesters) of 5 l capacity under mesophilic and anaerobic conditions. Cylinder-shaped plastic digesters were equipped with gas detecting systems, slurry inlets, gas outlets, and gas storage tanks, and 2 l clinical urine bags were used as storage tanks.
The slurries prepared under different conditions (slurry ratios and sonication times) were loaded into the digesters in a random order to avoid any systematic error and allowed to undergo the anaerobic digestion process for a retention period (digestion time) of 21 days. The quantities of each slurry fed into digesters were according to the slurry ratio in Table 2. Volumes of the biogas produced were recorded at intervals of 48 h. The experiments were repeated based on the center points in the design of the experiment to determine pure error. Thus, in the CCD for two factors of the present study, five center points were considered (runs 1, 3, 7, 11, and 12). After obtaining the outcome (volume of biogas produced across 21 days) from the anaerobic digestion experiments, the recorded volumes were inputted to the software as responses. By means of the CCD, the software uses the responses to calculate and predict the optimum sonication time and slurry ratio for the maximum production of biogas.
Validation of the Experiment
The prediction by CCD was tested and validated experimentally, and the experimental and predicted values were compared to justify the validity of the prediction. Error deviations lower than 30% were acceptable in the validation run (Chun et al., 2015).
Results and discussion
As discussed in this study, the rate-limiting and timeconsuming nature of anaerobic digestion can be addressed through ultrasonic pretreatment of the organic waste and providing an optimum ratio of the slurry. The volumes of biogas produced under different conditions set by the CCD are presented in Table 3. Run 4 (sonication time of 15 min and slurry ratio 2.3 : 1.0) resulted in the highest biogas production of 24.85 ml, whereas run 6 (sonication time of 15 min and slurry ratio of 0.19 : 1.0) resulted in the lowest, 17.82 ml. Although these runs fall under the four axial points of the experimental design, insignificant differences were observed in the responses for all the five center points, which were repetitions to determine the pure error (23.16, 23.68, 23.05, 22.98, and 23.64 ml for runs 1, 3, 7, 11, and 12, respectively).
Table 3
Volumes of biogas produced under different setup conditions
Equation (1) establishes the relationship between the factors (sonication time and slurry ratio) and response (volume of biogas produced), which also shows the reduced quadratic model obtained for sonication time (A ) and slurry ratio (B ) for the volume of biogas produced:
Optimization of factors
The 3D graph plot shown in Figure 1 illustrates the effects of sonication time and slurry ratio on the volume of biogas production. As shown in the figure, slurry ratio and sonication time were significantly correlated with the volume of biogas produced. Moreover, the volume of biogas produced increased with an increase in slurry ratio from 0.5 to 2.0 (18.65–24.13 ml) and an increase in sonication time from <10 to 20 min (18.72–20.82 ml). Beyond this sonication time, the production of biogas decreased.
Fig. 1
3D surface showing the interaction between sonication time, slurry ratio, and volume of biogas produced
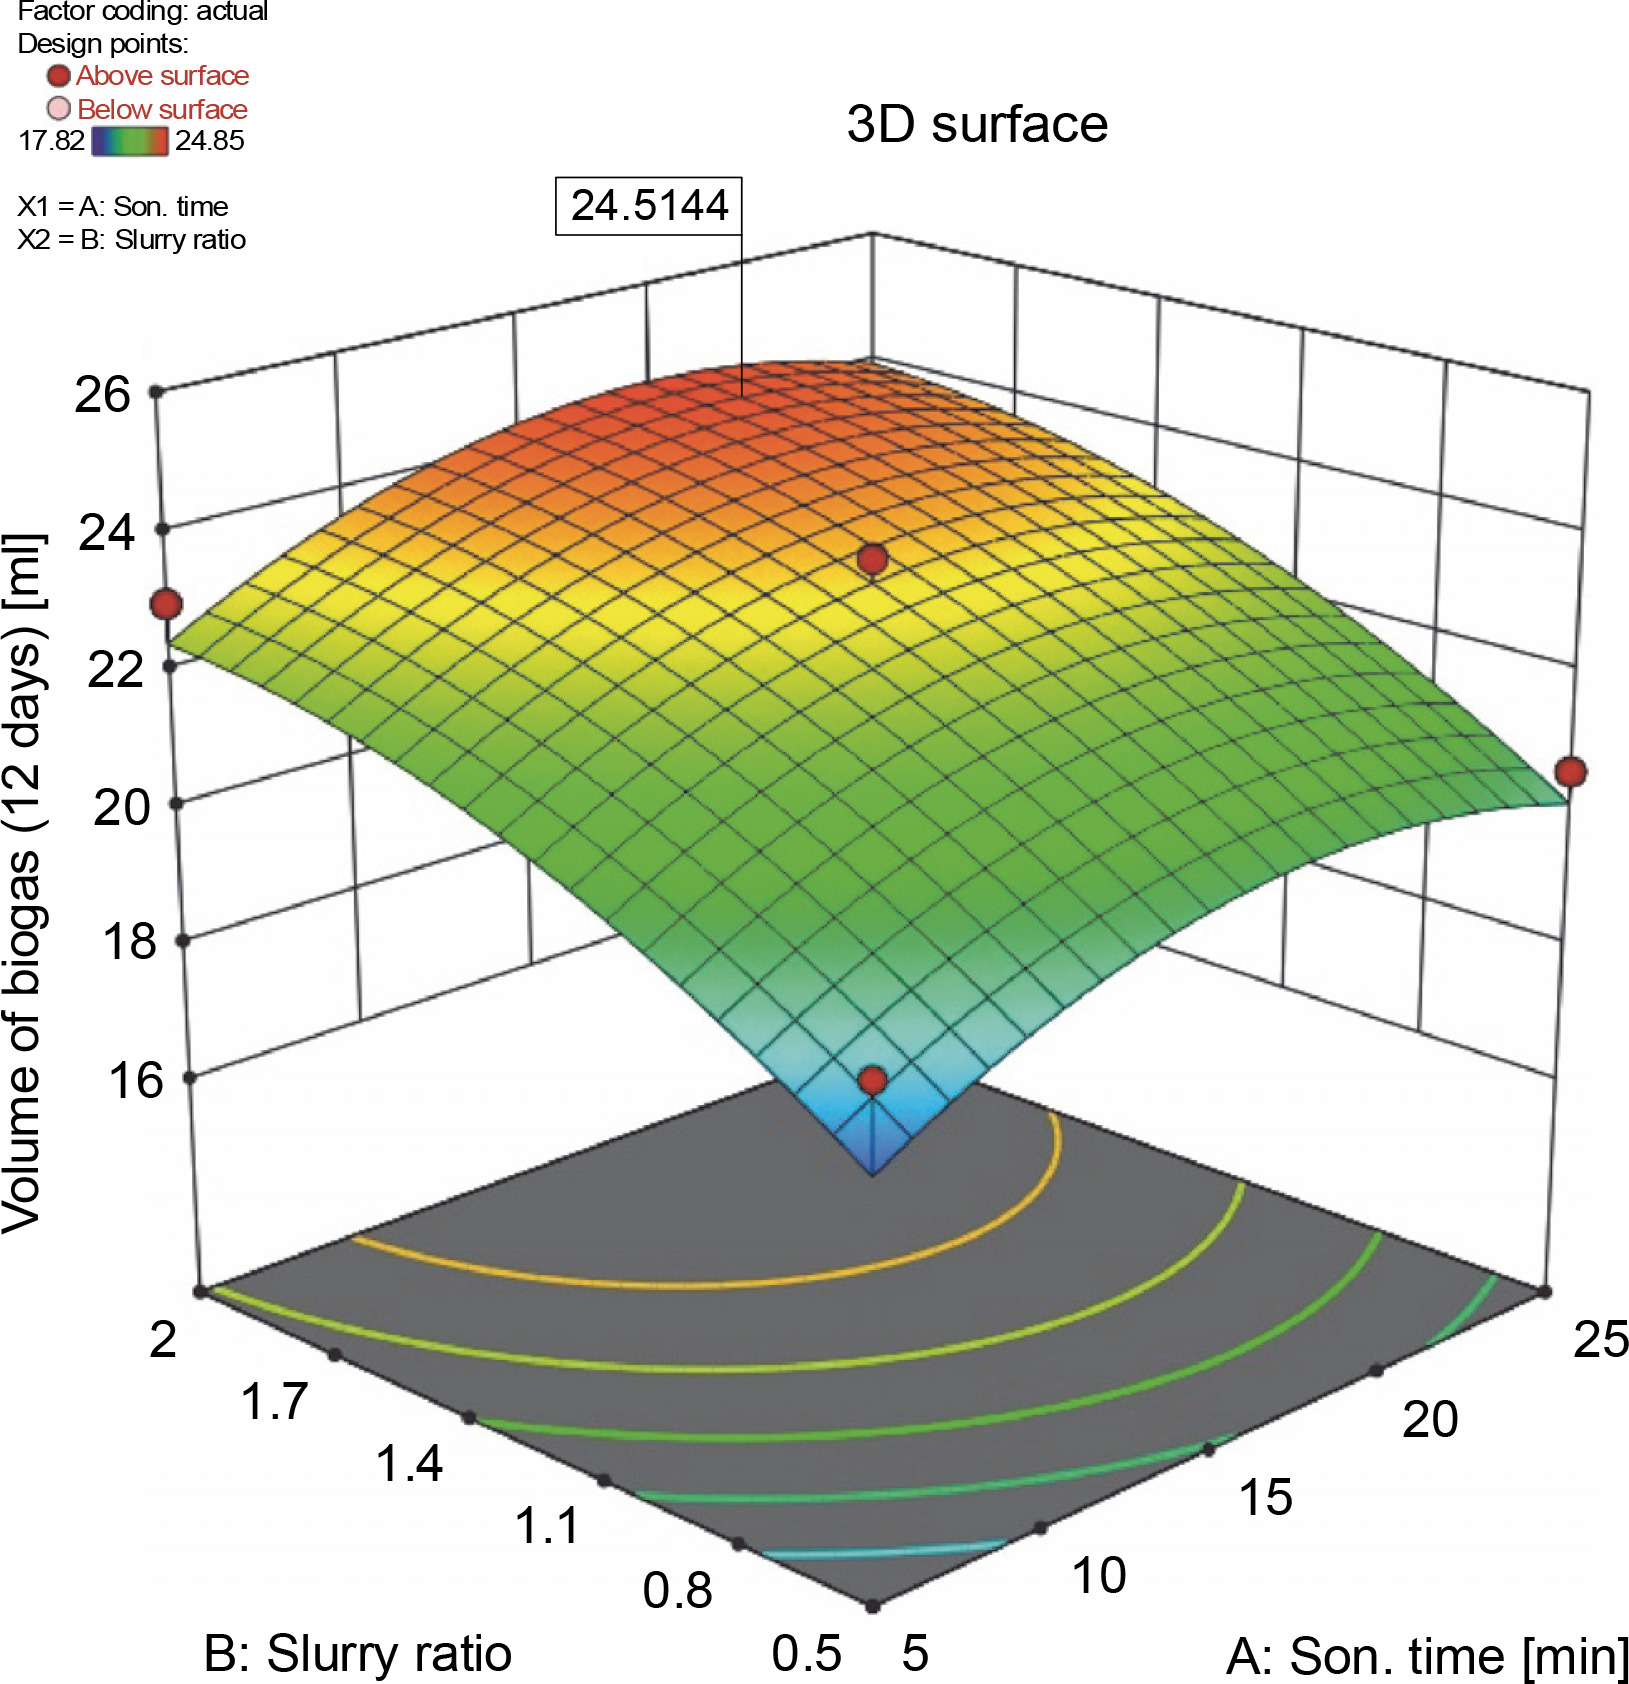
Based on the numerical and point prediction optimizations using the Design Expert software, sonication for 18.16 min and a slurry ratio of 2.0:1.0 were estimated as the optimum conditions for the maximum biogas production, which was 24.51 ml in 12 days.
As shown in Figure 1, the 3D response surface plot for the regression equation showed moderate relationships between the variables. Results of the analysis confirmed that the response model was adequate for reflecting the expected optimizations and that equation (1) was accurate and satisfactory.
Similar results have been obtained in a previous study using RSM for the prediction of biogas and biomethane production by means of codigestion of poultry manure and food waste (Yusof et al., 2014). Such findings have also been observed in earlier studies that used RSM for prediction in bioprocessing operations of cashew apple juice for oxalic acid production (Emeko et al., 2015). Further-more, Wu-Haan (2010) reported that higher methane production was achieved with an increase in ultrasonic amplitude and treatment time of animal manure, particularly beef and swine, and that the highest methane production was obtained with the highest power and longest treatment time. Reyhaneh et al. (2017) stated that the highest methane yield from fruit and vegetable wastes was achieved in the digester with a sonication time of 18 min at 12 days of anaerobic digestion.
The predicted optimum volume of biogas from chicken droppings (24.51 ml) was validated under the same conditions in this study, and the actual volume of biogas produced was 22.28 ml. The actual value was close to the predicted value, thus confirming the validity and adequacy of the predicted models as 10.02% was the recorded error. As previously mentioned, the acceptable percentage of error is 30% (Chun et al., 2015).
While comparing the findings of the present study with those of previous results, it is worth noting that most studies focused on the ultrasonic pretreatment of wastewater sludge, not chicken droppings or other animal wastes. However, the present study is focused on animal wastes, particularly chicken wastes, because of the ease of access and availability in Nigeria. In addition, in a comparative study of biogas production from kitchen waste, animal waste, waste flowers, and waste leaves, Mandal and Mandal (1997) revealed that animal wastes were the most suitable ones for the production of biogas in terms of yield. Besides, Fluid Biogas (2019) reported that animal manure is the most preferred substrate for biogas production as it creates and maintains an anaerobic environment in the digester, along with other factors such as temperature regime, availability of the nutrients for bacteria, correct choice of retention time, and absence of inhibitors. In addition, Sara (2017) reported that in comparison with food waste, landfill gas, wastewater treatment sludge, and crop residues, animal wastes are more difficult to be decomposed by microorganisms.
Similarly, previous studies have reported that ultrasonic pretreatment is more effective for animal wastes as they contain large fractions of particulate matter (Wu-Haan, 2010). Henceforth, this pretreatment process was considered a suitable one for the present study as it resulted in uniform slurry and reduced the retention time.
When compared with other pretreatment methods, ultrasonication has proved to be the most polyvalent as it has been effective for different types of solid substrates (Reyhaneh et al., 2017). Cesaro and Belgiorno (2014) proposed that ultrasonication was more competitive as a pretreatment technique as it increased the solubilization rate of organic matter. Furthermore, biogas production is, in fact, the result of biodegradation of organic components. This leads to a reduction of solids present in the digester (Reyhaneh et al., 2017). Moreover, reduction of total solids is directly related to biogas yield at different ultrasonic exposure times (Reyhaneh et al., 2017).
As shown in Table 4, ANOVA showed that the model with a P value of 0.0012 was considered significant. Similarly, for the models, R 2 value was 0.8717, F value was 13.58, and lack of fit was 14.69. The F value revealed the significance of the regression model, and this finding is consistent with the report of Montingelli et al. (2016). While using the R 2 value to verify the fitness of models, the value should be at least 0.80 for a good fit (Pei et al., 2014). Thus, the high R 2 values of the models agree with the experimental data (Giwa et al., 2013). P values < 0.0500 indicate that the model terms are significant, whereas values > 0.1000 indicate that the model terms are not significant (Stat-Ease, 2018). Based on the values obtained in the present study, it can be stated that the model was adequate for the design space navigation.
Table 4
Results of analysis of variance of the study
Conclusions
The findings of this study confirmed that pre-treatment enhanced the biogas production during the anaerobic digestion of chicken droppings. Prior to anaerobic digestion, the organic waste was subjected to ultrasonic pretreatment, and sonication time and slurry ratio were optimized to achieve maximum biogas production. This study further showed that biogas production can be significantly increased with a high slurry ratio and sonication time. However, one of the major drawbacks of the ultrasonic pretreatment process is the energy consumption associated with the sonicator. In other words, a longer sonication period results in higher consumption of energy. In addition, sonicators are rarely available in research laboratories and industries in Nigeria; hence, improvement of the system is recommended to ensure commercial and industrial availability.