


Introduction
Invasive alien species, also known as introduced species, are not native to a specific location and have a tendency to establish, proliferate, and threaten native ecosystem and habitats (Kohli et al., 2006). When introduced outside their intrinsic range, they spread rapidly and aggressively into any new region regardless of varying environmental factors (Dhami, 2018). Invasive plant species often have negative impacts on agriculture and society in addition to their detrimental effects on biodiversity and environment (Rai and Singh, 2020; Bajwa et al., 2019a,b). It is therefore important to assess such impacts to develop effective management plans (Bajwa et al., 2019a,b). Worldwide, invasive species are widely distributed in natural and agricultural areas and affect native vegetation (Henkel et al., 2009). Of the many plants that are introduced into a new habitat, only a few become invasive, which suggests the existence of some special characteristics or traits that support invasiveness in particular plants. The success of plant species in an alien environment has been ascribed to lack of natural predators or possession of novel weapons such as allelopathy (a phenomenon in which a plant releases chemicals into soil that may harm the growth of other plants) (Heirro and Callaway, 2003). The majority of invasive species are alien, but it is important to note that native species may also become invasive, usually under altered environmental conditions such as grazing, cyclones, changes in nutrient regimes, colonization by an invasive species, or other alterations (Ebi et al., 2017; Pinzone et al., 2018). Invasive species are also able to undergo genetic variations due to selection pressure and respond rapidly to anthropogenic disturbances (Zheng, 2015, Pinzone et al., 2018). Invasion is deliberated as the second most widespread hazard to global biodiversity. Climate change and invasion may interact with climate-changing conditions, thus favoring and facilitating the spread of non-native species.
Various environmental stress factors adversely affect plant growth and limit plant production (Choudhury et al., 2017). Extreme temperatures, heat, drought, nutrient imbalance, ultraviolet radiation, and nutrient deprivation are the major stress factors. Changes in temperature conditions occur more rapidly, and therefore, temperature tolerance is a potential contributor to the success of invasive species (Zerebecki, 2011). Through natural processes, plants have developed various strategies to tackle certain stress conditions. It is known that the production of a large number of natural products entirely depends on the growth conditions of plants, such as temperature, light, and nutrient supply (Jasper et al., 2020, Isayenkov and Maathuis, 2019). A wide range of experiments have shown that when plants are exposed to heat stress, they tend to accumulate high concentrations of secondary metabolites, and such enhancement is reported to occur in nearly all classes of natural products, such as simple or complex phenols, flavonoids, numerous terpenes, alkaloids, cyanogenic glycosides, and glucosinolates (Isah, 2019). However, their role in invasive alien plants remains controversial.
Fingerprint techniques are one of the modern approaches for analyzing several metabolites (Grauwet et al., 2014, Esslinger et al., 2014). Chemical portrait obtained by fingerprinting is representative of the ecosphere where the plant grows. Recently, biological insights have also been obtained from fingerprinting analysis of plants subjected to abiotic stress (Gavicho et al., 2020). A variety of techniques can be used to identify and quantify the presence of phytoconstituents and secondary metabolites in plants. These techniques have been proved to be useful for the analysis of the metabolic profile of plants under various environmental conditions. Chemical fingerprinting using spectroscopic techniques is an important tool to study different patterns of plant metabolic variations in different conditions (Sermakkani et al., 2012). Environmental factors affect the metabolic pathways of plants and produce different patterns of chemical composition, leading to variations in their fingerprints. Nonetheless, spectral fingerprinting is gaining attention in the area of agriculture and metabolomics (Pauli et al., 2016). Spectral fingerprint is a technique in which light (UV or IR region of the spectrum) interacts with the bonds in biomolecules, which resonate at particular frequencies, thus giving each molecule a “spectral fingerprint or absorption signature” (Pauli et al., 2016; Gavicho et al., 2020). Therefore, spectral fingerprinting-based techniques have been extensively used to identify bioactives or phytoconstituents such as phenolics and flavonoids in plant extracts and for the evaluation of herbal plants (Pauli et al., 2016; Salem et al., 2020).
Among all the invasive plants included in this study, Lantana camara L. (Verbenaceae ), commonly known as wild or red sage, is a pantropical weed. (Kohli et al., 2006). L. camara tolerates a wide range of ecological and climatic factors, and its occurs in diverse habitats and on a variety of soil types (Negi et al., 2019). Parthenium hysterophorous L. (Asteraceae ) is a noxious plant that inhabits many parts of the world and is designated as one of the most troublesome weed species of urban and rural India (Prasad and Sankaran, 2018). P. hysterophorous grows well in agricultural lands, forests, orchards, poorly managed arable crop lands and rangelands, wastelands, public lawns, roadsides, railway tracks, and residential plots (Kaur et al., 2014). Ricinus communis L. (Euphorbiaceae ) is frequently referred to as castor or castor bean, and it has a height of 6 m or more (Marrat et al., 2017). R. communis L. is a native of Africa and India and is distributed throughout the tropical, subtropical, and temperate regions of the world. It is commonly observed in disturbed environments such as waste heaps, roadsides, forest edges, and urban vacant lots (McKeon and Brichta, 2014). Ageratum conyzoides L. (Asteraceae ), commonly known as billygoat weed, goatweed, etc. is a small, aromatic, annual herb native to Tropical America, but has expanded its habitat to several different countries of the world, and it is generally found in cultivated fields and other ecosystems such as pastures, grasslands, wetlands, and even forest areas (Rafaela et al., 2016).
Despite many studies, there is little knowledge on the various mechanisms involved in the tolerance of the invasive plants L. camara, P. hysterophorus, R. communis, and A. conyzoides to stressful environmental conditions. Thus, the present study was performed to gain insights into the possible causes of vast adaptability and invasiveness of these plants. Our study aimed to provide a comprehensive understanding of the chemical profile of invasive plants through a qualitative analysis of their secondary metabolites by using spectral techniques. It was hypothesized that these plants produce various cell signaling molecules in response to stress conditions, which enable them to adapt against stress. This study reports chemical fingerprint profile of metabolites under different temperature conditions in L. camara, P. hysterophorus, R. communis, and A. conyzoides in their natural environment.
Materials and methods
The plant species, namely L. camara L., P. hysterophorus L., R. communis L., and A. conyzoides L. (supplementary Fig. 1) were collected (April and June 2020) growing under natural conditions in the vicinity of Jalandhar, India (30°33′N longitude and 71°31′E latitude). The city has a humid subtropical climate with cool winters and long, hot summers. The climate is dry overall. The mean and max/min temperatures and day length were recorded (Table 1). The study followed the random sampling method to avoid introduction of any bias. For random sampling, approximately 30 plants of L. camara L. and P. hysterophorus L., 25 plants of A. conyzoides L., and 15 plants of R. communis L. (all in three replicates) were sampled at the reproductive stage (leaves from all plants and flowers from L. camara, P. hysterophorus, and A. conyzoides) in the given location and pooled together for further analysis. Immediately after sampling, all the tissues were stored in black polythene bags, transported to the laboratory within 2 h of sampling, and stored at 4°C until further analysis.
Table 1
Parameters recorded at the time of sampling of tissues during different months
| Month | Minimum temperature [°C] | Maximum temperature [°C] | Day length |
|---|---|---|---|
| April | 13 | 35 | 12 h 50 min |
| June | 25 | 44 | 13 h 30 min |
Fig. 1
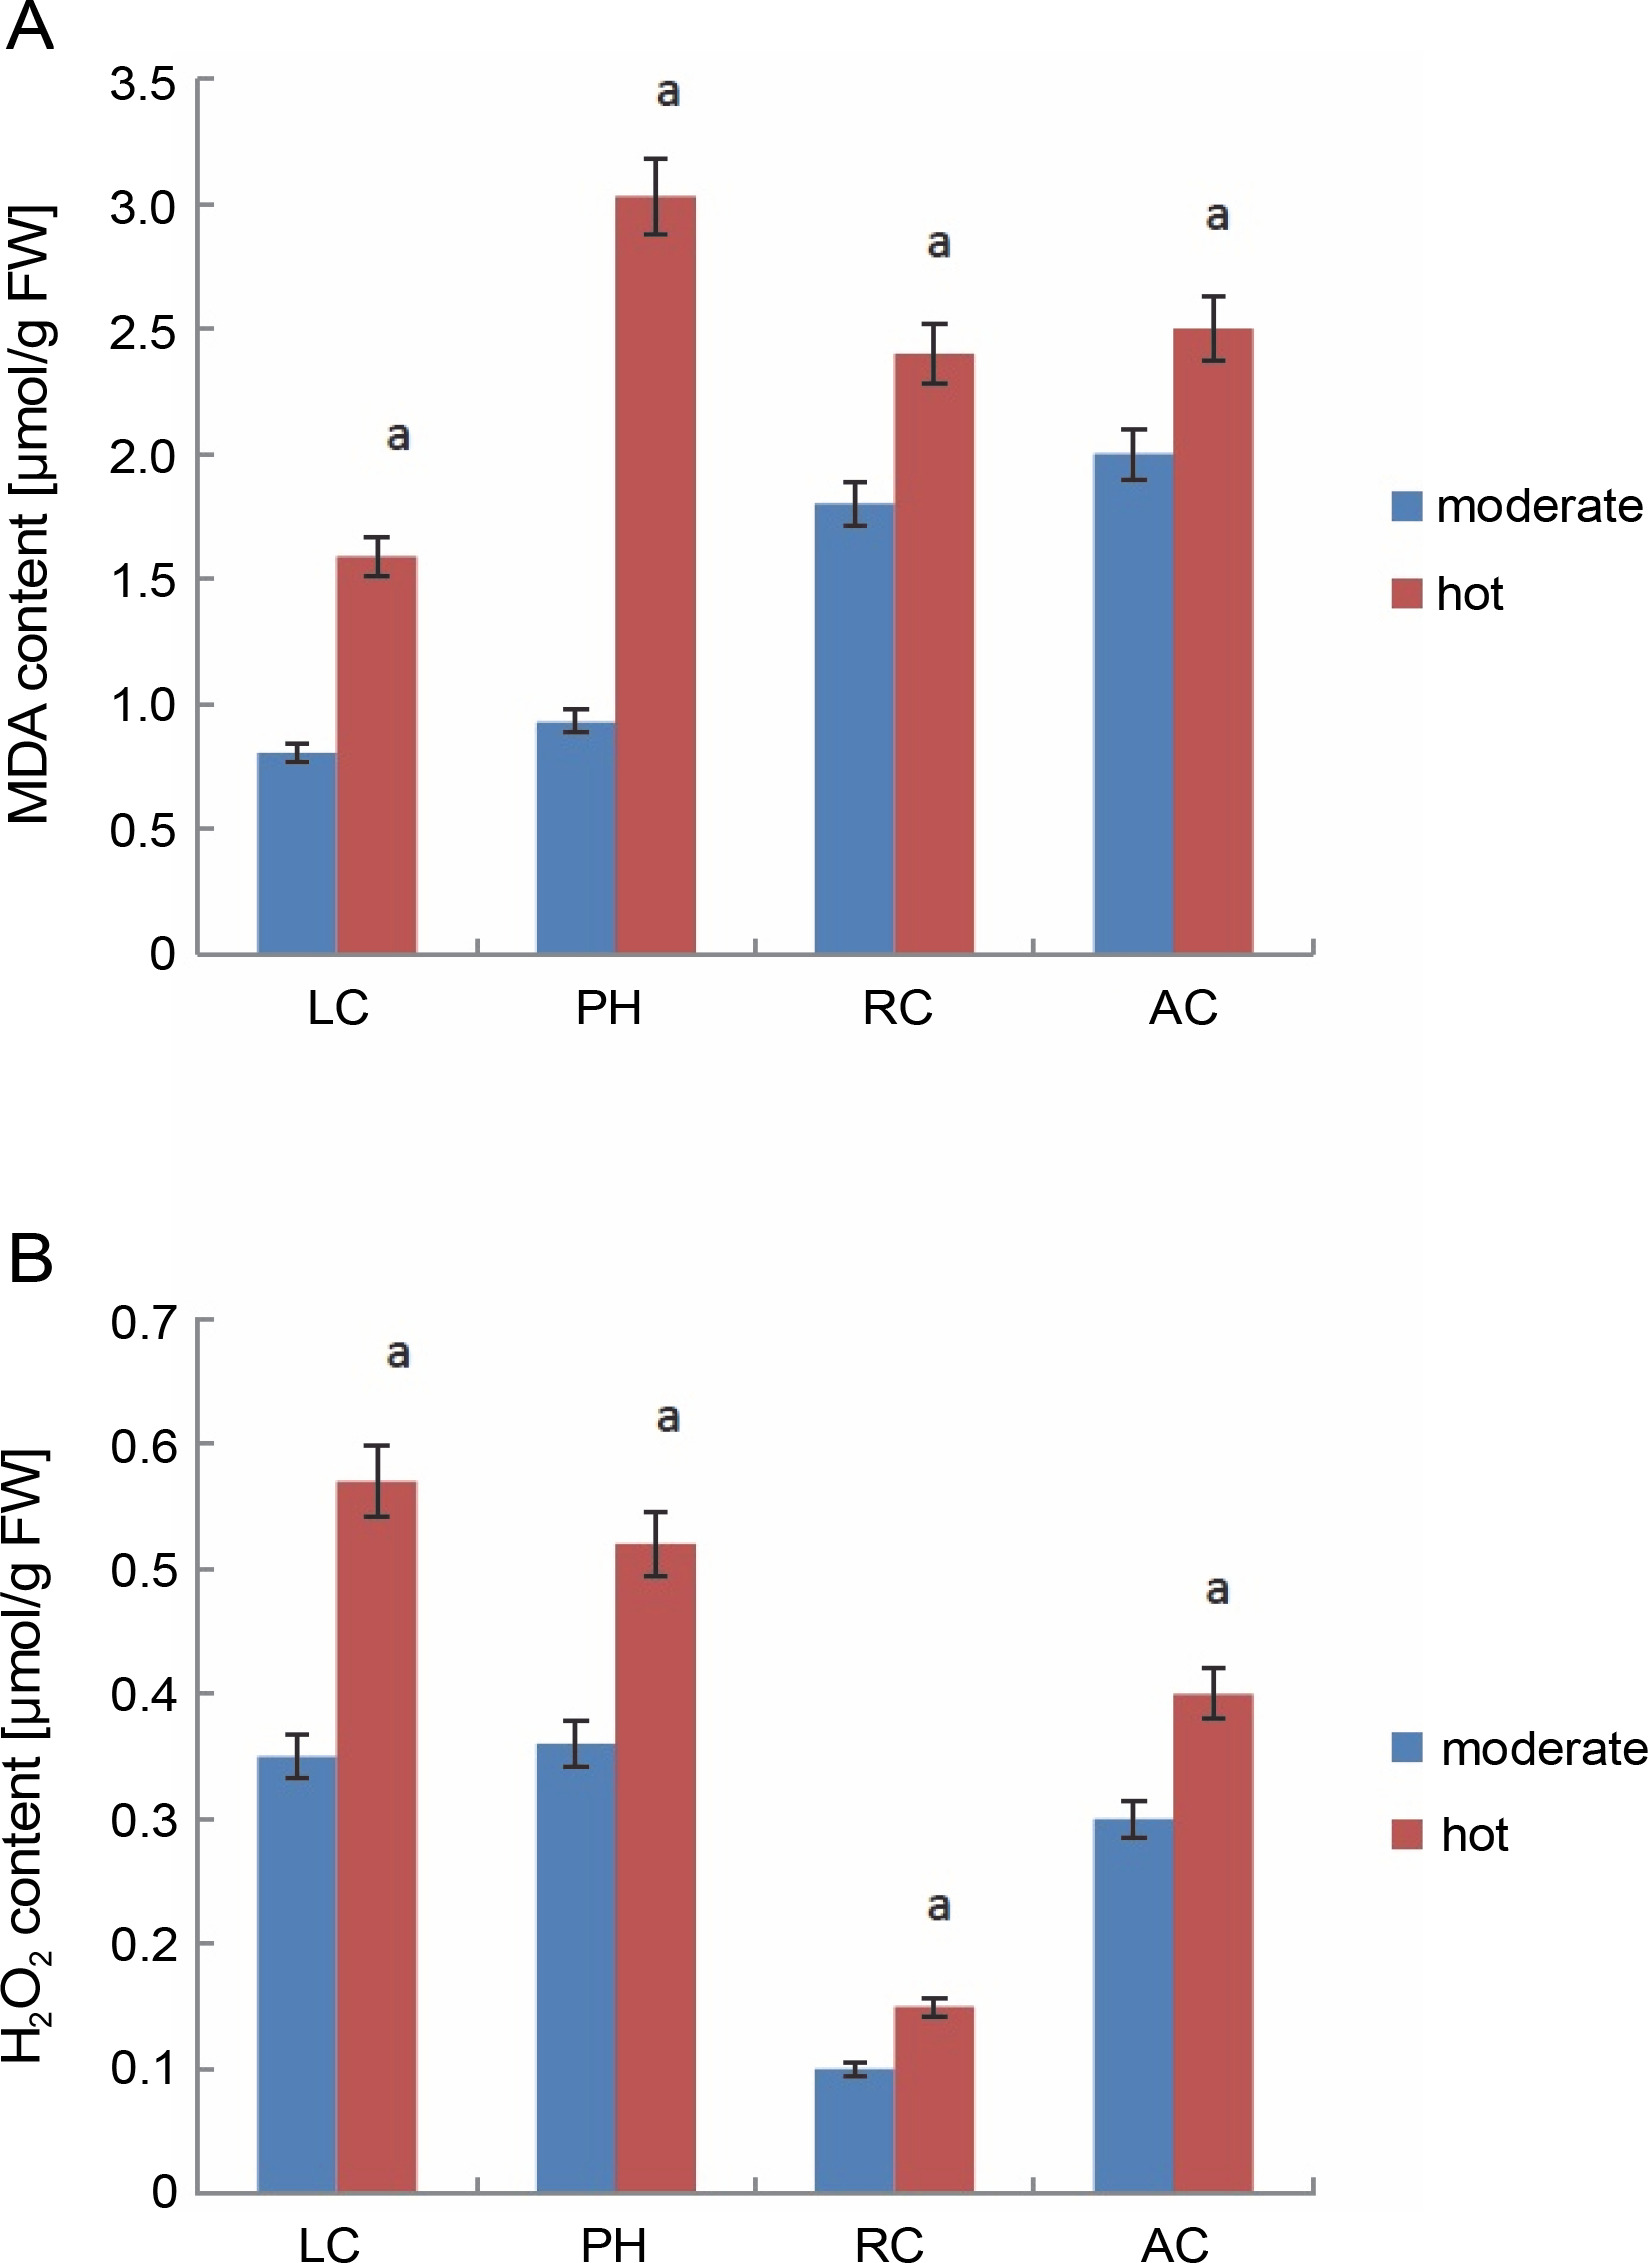
MDA and H2O2 contents in leaves under different temperature regimes. Values are means of three replicates ± SE; means with different letters are significantly different at P < 0.05 using Tukey’s multiple range test; symbols: LC – Lantana camara, PH – Parthenium hysterophorus, RC – Ricinus communis, AC – Ageratum conyzoides
Extraction of secondary metabolites
The collected tissues of L. camara, P. hysterophorus, A. conyzoides, and R. communis (leaves and flowers, 5 g) were homogenized in 15 ml of each of the solutions (acetone/ethanol/methanol, CDH, India). The crude extracts were then centrifuged for 15 min at 10 000 rpm at room temperature. The supernatants were collected. An appropriate aliquot of each extract was filtered through 0.2 μm syringe filters (PALL Life Sciences) and stored in 2 ml storage vials at –20°C prior to further analysis.
Estimation of lipid peroxidation (MDA) and hydrogen peroxide (H2O2)
H2O2 content was determined spectrophotometrically after reaction with potassium iodide (KI) (CDH, India) by the method described previously by Alexieva et al. (2001). Samples (0.5 g) of the four plant species were homogenized in 0.1% trichloroacetic acid (TCA) (CDH, India). The reaction mixture contained 0.5 ml of 0.1% TCA-extracted supernatant, 0.5 ml of 50 mM Tris-HCl buffer (pH 7.0, CDH, India), and 2 ml of 1 M KI reagent. TCA (0.1%) in the absence of extracts was used as a blank probe. Tubes containing the reaction mixture were incubated for 1 h in darkness, and the absorbance was recorded at 390 nm using a double beam UV-Vis spectrophotometer (ELICO 112, Chandigarh, India). The H2O2 content was estimated by a standard curve prepared using different known concentrations of H2O2 and expressed as μmol/g FW.
Lipid peroxidation was estimated by the level of malondialdehyde (MDA) generated by the thiobarbituric acid (TBA) reaction. Fresh leaf samples of the four plants were homogenized in 10% TCA containing 0.25% TBA (CDH, India). The mixture was heated at 100°C for 30 min and then quickly cooled on ice bath and centrifuged at 10 000 × g for 10 min. The absorbance of the supernatant was read at 532 nm for the spectrophotometric determination of MDA, and correction for unspecific turbidity was performed by subtracting the absorbance of the same at 600 nm using a double beam UV-Vis spectrophotometer (ELICO 112). MDA content was calculated with extinction coefficient of 156 mM–1 cm–1 using the following formula: MDA [μmol/g FW] = [(A532 – + A600 ) / / 156] × 106 × dilution factor.
Chemical fingerprinting with UV-Vis, FT-IR, and fluorescence spectroscopy
UV spectral fingerprinting profiles of the collected flowers and leaves were studied under two different temperature regimes, i.e., as hot (in June) and moderate (in April). UV-Vis analysis of the extracts was conducted using a UV-Vis spectrophotometer (Labtronics 300, Labtronics Pvt. Ltd., Panchkula, Punjab, India) with a slit width of 2 nm with a 10-mm cell. For this purpose, 2 ml of extracts was taken in a quartz cuvette, and the absorbance peaks were recorded at the wavelength ranging from 200 to 400 nm. The eight chemical standards (all from CDH, India), namely Rutin (in methanol), Phenylalanine (in distilled water), Glutathione Reduced (in distilled water), Glutathione Oxidized (in distilled water), Tannic acid (in ethanol), Glycine Betaine (in ethanol), Proline (in ethanol), and Vanillic Acid (in methanol), were prepared in appropriate solvents. These analytes were identified by comparing their UV fingerprint spectra with those of the extracts. FT-IR spectroscopy was performed to identify the functional groups. A small amount of extract was taken in a sample cup of a diffuse reflectance accessory. The IR spectrum was obtained using an FT-IR spectrophotometer (Perkin Elmer Spectrum II, Chicago, USA). The sample was scanned from 4000 to 400 cm–1, and peaks were recorded. The fluorescence spectrum of the extracts was measured on a Perkin Elmer spectrophotometer (Perkin Elmer FL6500, Chicago, USA). The supernatant was taken in a cuvette, and the fluorescence was measured at an excitation wavelength of 300 nm. The final volume taken for fluorescence analysis was 3 ml, and the characteristics peaks were detected. All experiments were performed at room temperature (~30°C).
Results and discussion
Alien plants use several ecobiochemical strategies to adapt to adverse stress conditions (Rai and Singh, 2020). It is expected that in the near future, more acute, more persistent, and long-term heat waves would prevail due to global warming, which could have substantial ecological effects (Zheng, 2015). Invasion by alien plants is one of the major components of global environmental change and is likely to cause tremendous damage to ecosystem structure and function by affecting biodiversity and economy (Pinzone et al., 2018; Rai and Singh, 2020). Scientific communities have not paid sufficient attention to alien plants even though these plants exhibit high taxonomic diversity, rapid spread, and wide distribution. Consequently, the underlying biochemical mechanisms related to adaptation and high resistance to stress factors such as high temperature and light intensity and the ability of these plants to expand rapidly in a natural ecosystem are poorly understood.
In the present study, we tested whether elevated expression levels of secondary metabolites provide a greater capability to the invasive species L. camara L., P. hysterophorous L., R. communis L., and A. conyzoides L. to respond to stress events and possibly contribute to their invasion success. As shown previously, temperature tolerance is a likely contributor to the success of invasive species due to the accumulation of secondary metabolites (Rysiak et al., 2021). The present study aimed to provide comprehensive insights into the changes in the accumulation of secondary metabolites in the four abovementioned invasive species under environmental conditions such as temperature and light duration.
Changes in MDA and H2O2
MDA, which is usually used to represent the level of lipid peroxidation, is generally considered as a sensitive marker to assess oxidative stress induced by adverse abiotic conditions (Rakhra and Sharma, 2015). The changes in MDA content are a key criterion for evaluating the stress tolerance of plants under stress conditions. Under adverse conditions such as high temperature (heat in June), MDA content in all the invasive plants (Fig. 1A) was higher than that under moderate temperature conditions (in April), indicating that plants are experiencing stress. Under hot conditions, MDA content values for L. camara, P. hysterophorous, R. communis, and A. conyzoides were 1.5, 3.0, 2.4, and 2.5, respectively. Among all the invasive plants, P. hysterophorous experienced more oxidative stress as evidenced by the maximum MDA value of 3.0. R. communis, and A. conyzoides showed almost similar level of lipid peroxidation. Collectively, high amounts of MDA were observed in almost every plant under high temperature conditions, indicating that high stress induced membrane lipid peroxidation. Higher MDA values in the range of 200–1400 (nmol/g DW) were reported by Rysiak et al. (2021) in Heracleum sosnowskyi (L.) species under high temperature stress conditions. Rivas et al. (2020) also noted that exposure of Calotropis procera (L.) plants to drought-like conditions resulted in higher MDA levels (90–120 nmol/g DW).
Biochemical studies also confirmed the existence of oxidative stress as enhanced level of H2O2 was detected after heat stress in all the invasive plants (Fig. 1B). H2O2 values were 0.57 for L. camara, 0.52 for P. hysterophorous, 0.15 for R. communis, and 0.40 for A. conyzoides. Thus, it is clear that L. camara and P. hysterophorous showed the same level of increase in H2O2. In contrast, R. communis showed less increase in H2O2 level. Rivas et al. (2020) also reported that Calotropis procera (L.) plants when exposed to water stress conditions showed higher H2O2 levels (200 mM/kg DW). Thus, H2O2 could be expected to be involved in stress signaling and in other important metabolic pathways conferring stress resistance to the plant.
Fingerprint analysis
Environmental stresses such as drought, low and high temperature, salinity, and alkalinity affect the biochemical metabolism of plants (Selmar et al., 2013). Because of their sedentary life, all plants adopt strategies to counter these stresses; however, only some of them do it better than other plants (Choudhury et al., 2017; Isayenkov and Maathuis, 2019; Rysiak et al., 2021). Plants have the potential to adopt strategies to neutralize the effect of various stresses. For example, they produce a number of secondary metabolites such as flavonoids, phenolics, terpenoids, and amino acids and increase the level of different enzymes to reduce the effect of ROS (Kumar et al., 2018; Isah, 2019; Rysiak et al., 2021). Various environmental factors influence metabolic pathways and induce completely different patterns of chemical composition, thereby causing variations in the fingerprint (Gavicho et al., 2020). Changes in metabolic profiles can be studied through chemical fingerprinting. This technology provides a comprehensive profile of all active biological components in the plant.
In the present study, UV spectral fingerprinting profiles of L. camara L., P. hysterophorous L., R. communis L., and A. conyzoides L. were studied under two different temperature regimes, namely hot conditions (in June) and moderate conditions (in April). A previous study showed that the recovery of metabolites from plant materials is influenced by their solubility in the extraction solvent, the type of solvent (polarity) used, and the degree of polymerization of metabolites and their interaction (Medini et al., 2014). A greater biodiversity of peaks was observed in all the extracts in a solvent-dependent manner (Table 1). For instance, the number of peaks of L. camara, P. hysterophorous, R. communis, and A. conyzoides extracts in acetone solvent were 42, 43, 53, and 37, respectively. Notably, the maximum number of peaks (53) was observed for P. hysterophorous. In contrast, A. conyzoides showed very less number of peaks (37). In terms of the solvent used, very less number of peaks (1–5) was observed for methanolic extracts. Our findings revealed that the total number of detected peaks was higher in acetone, followed by that in other solvents (ethanol and methanol). Hence, we did not use the remaining two solvents for subsequent experiments. Thus, heat stress-induced changes in UV spectral profiles were studied using acetone solvent alone.
UV spectral fingerprint analysis of L. camara, P. hysterophorus, A. conyzoides, and R. communis extracts revealed a substantial number of UV peaks (Table 2) under adverse hot abiotic conditions. R. communis showed the maximum number of peaks (344), followed by P. hysterophorus (335), L. camara (323), and A. conyzoides (250). Corresponding UV profiles of L. camara, P. hysterophorus, A. conyzoides, and R. communis are shown in Fig. 2–5. R. communis accumulated the maximum number of secondary metabolites as evident from UV peaks (344), while A. conyzoides showed less accumulation (250). Based on this finding, it was considered that in R. communis, hot temperature drastically triggered the production of several secondary metabolites as evident from their absorption spectrum. Compared to moderate conditions, a completely different set of peaks, both major and minor, from 200 to 400 nm with absorbance of 0.8–2.9 were observed under hot stress conditions in L. camara (Fig. 2), P. hysterophorus (Fig. 3), A. conyzoides (Fig. 4), and R. communis (Fig. 5), indicating the accumulation of secondary metabolites under hot conditions.
Table 2
Total number of peaks detected in UV spectroscopy of the extracts of different invasive plant species in three solvents
| Series number | Leaves | Total number of detected peaks | ||
|---|---|---|---|---|
| acetone | ethanol | methanol | ||
| 1 | LC | 42 | 14 | 3 |
| 2 | PH | 44 | 8 | 1 |
| 3 | RC | 53 | 11 | 5 |
| 4 | AC | 37 | 7 | 1 |
Fig. 2
UV fingerprinting analysis of Lantana camara leaves extracted in acetone under moderate (A) and hot (B) temperature conditions; numbers 1, 2, 3, and 4 indicate the presence of ascorbic acid, glutathione reduced, rutin, and vanillic acid, respectively
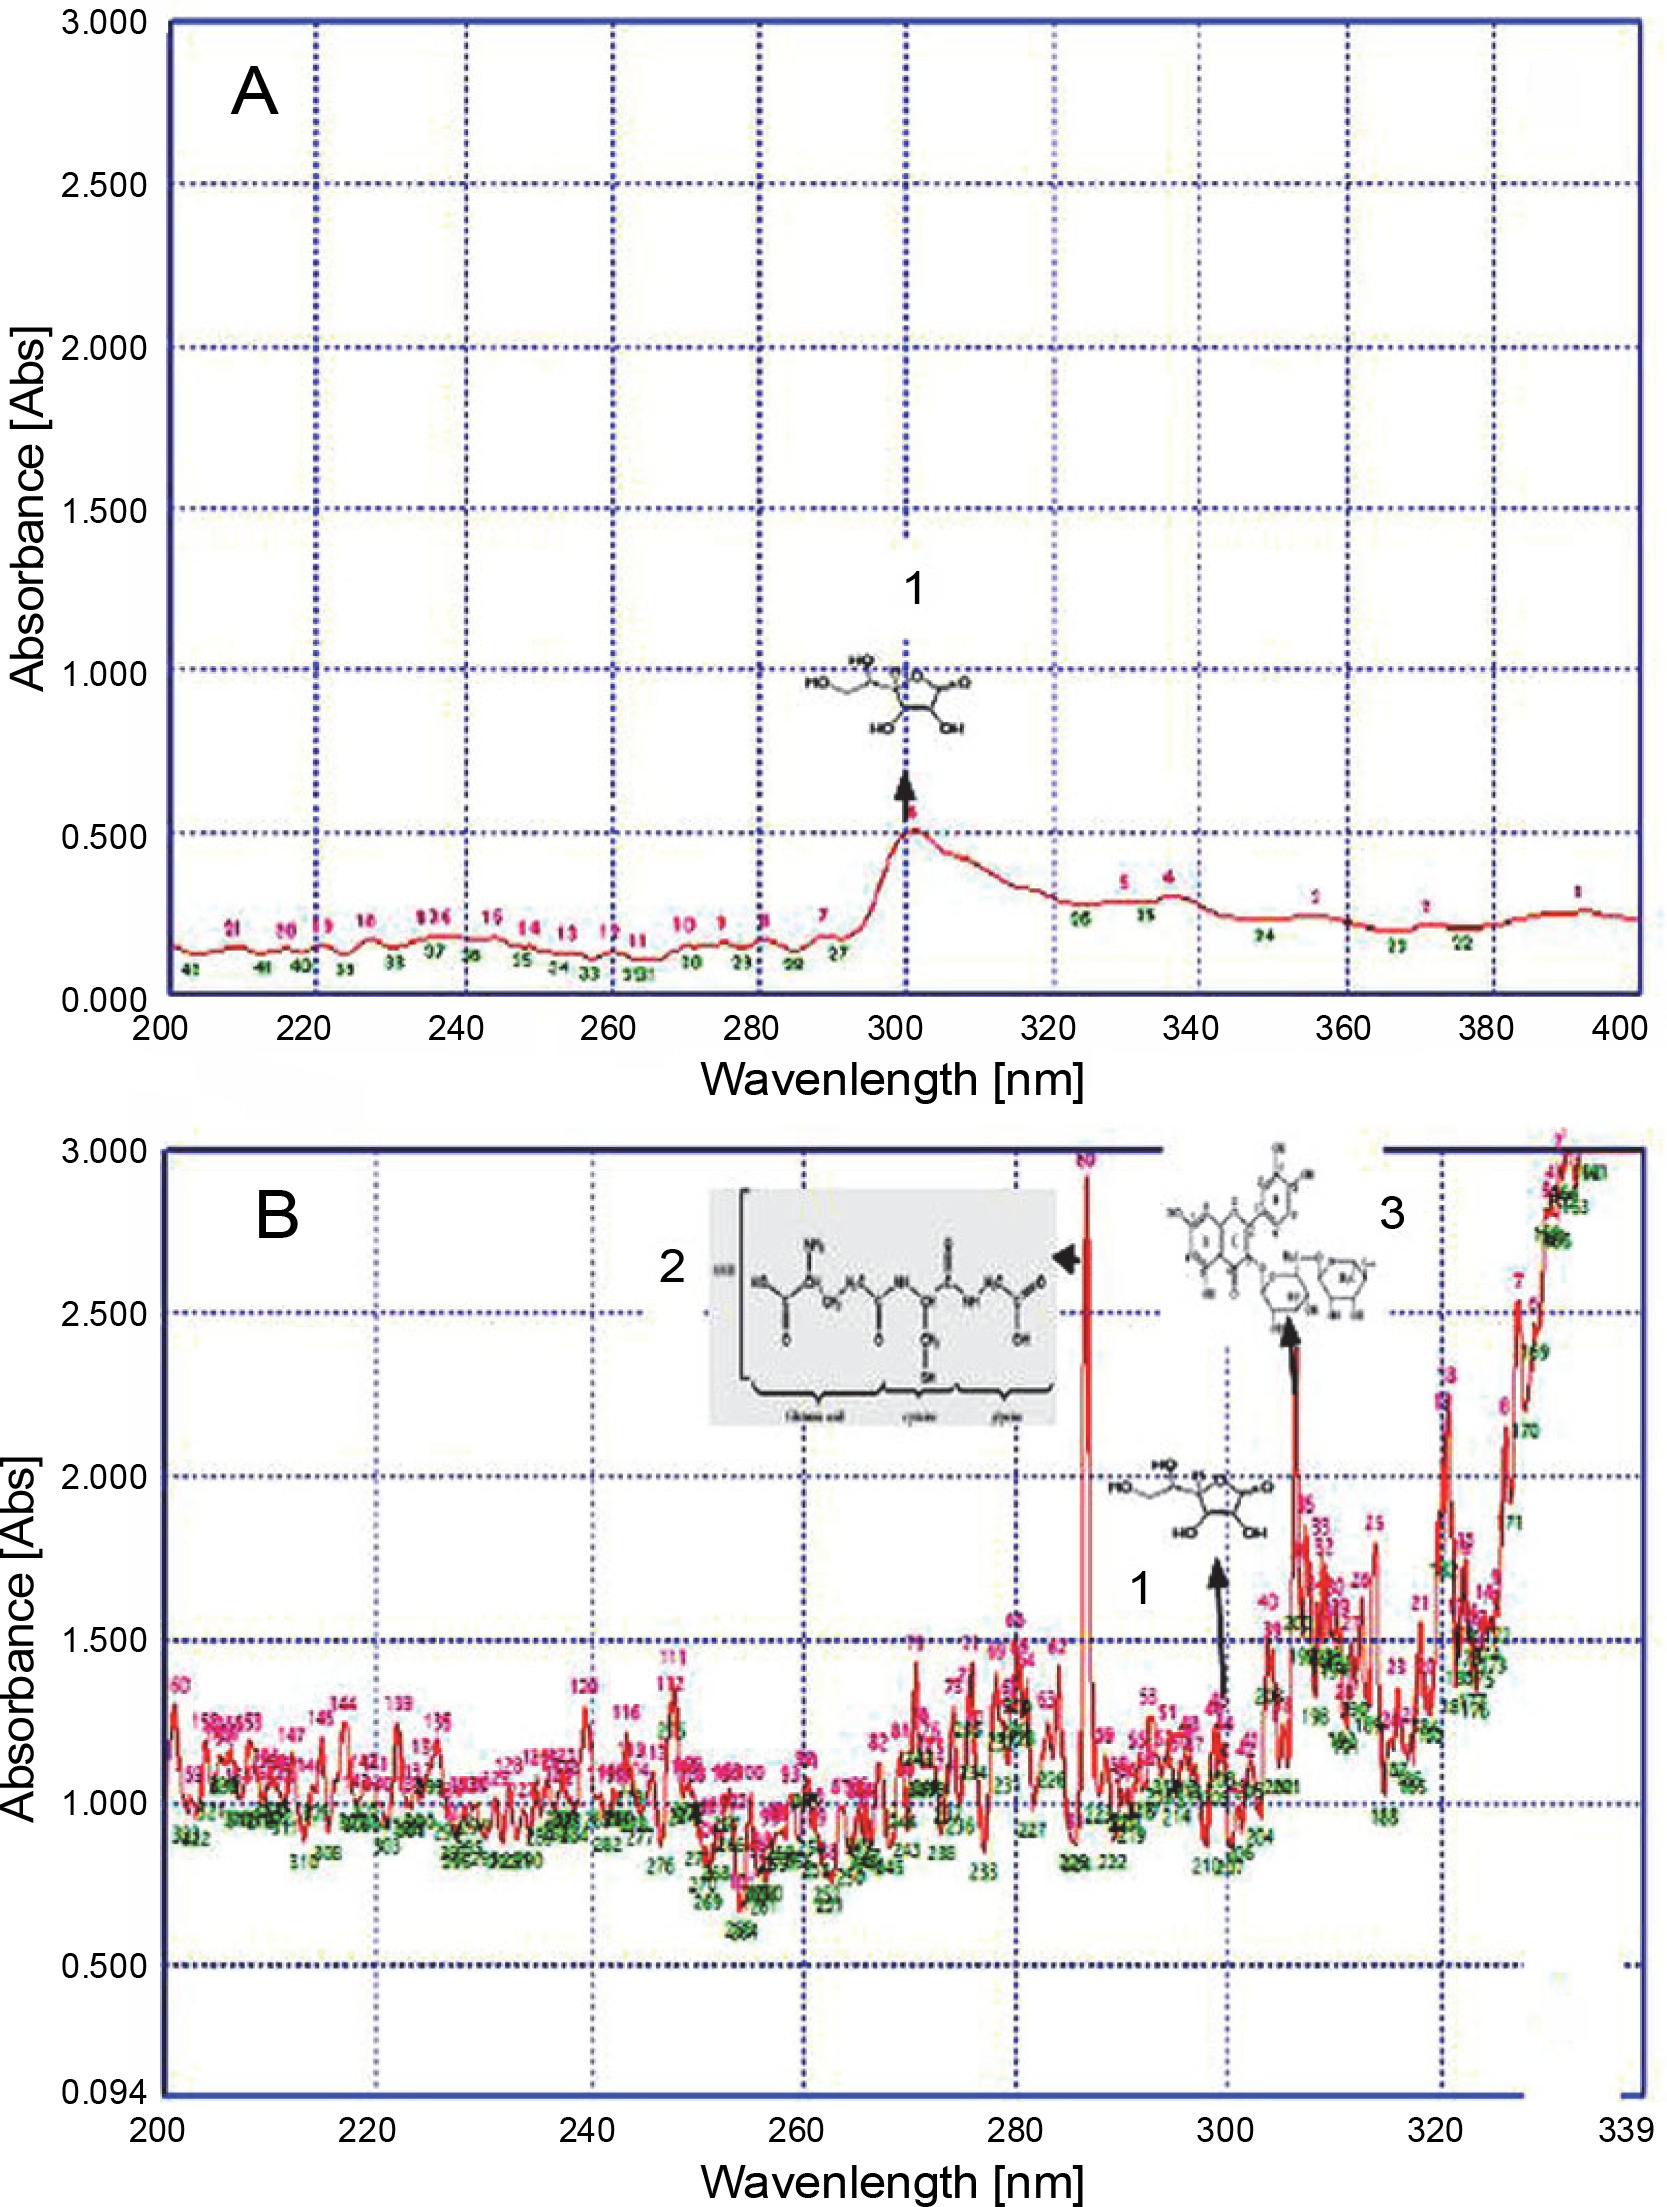
Fig. 3
UV fingerprinting analysis of Parthenium hysterophorus leaves extracted in acetone under moderate (A) and hot (B) temperature conditions. Numbers 1, 2, 3, and 4 show the presence of ascorbic acid, glutathione reduced, rutin, and vanillic acid, respectively
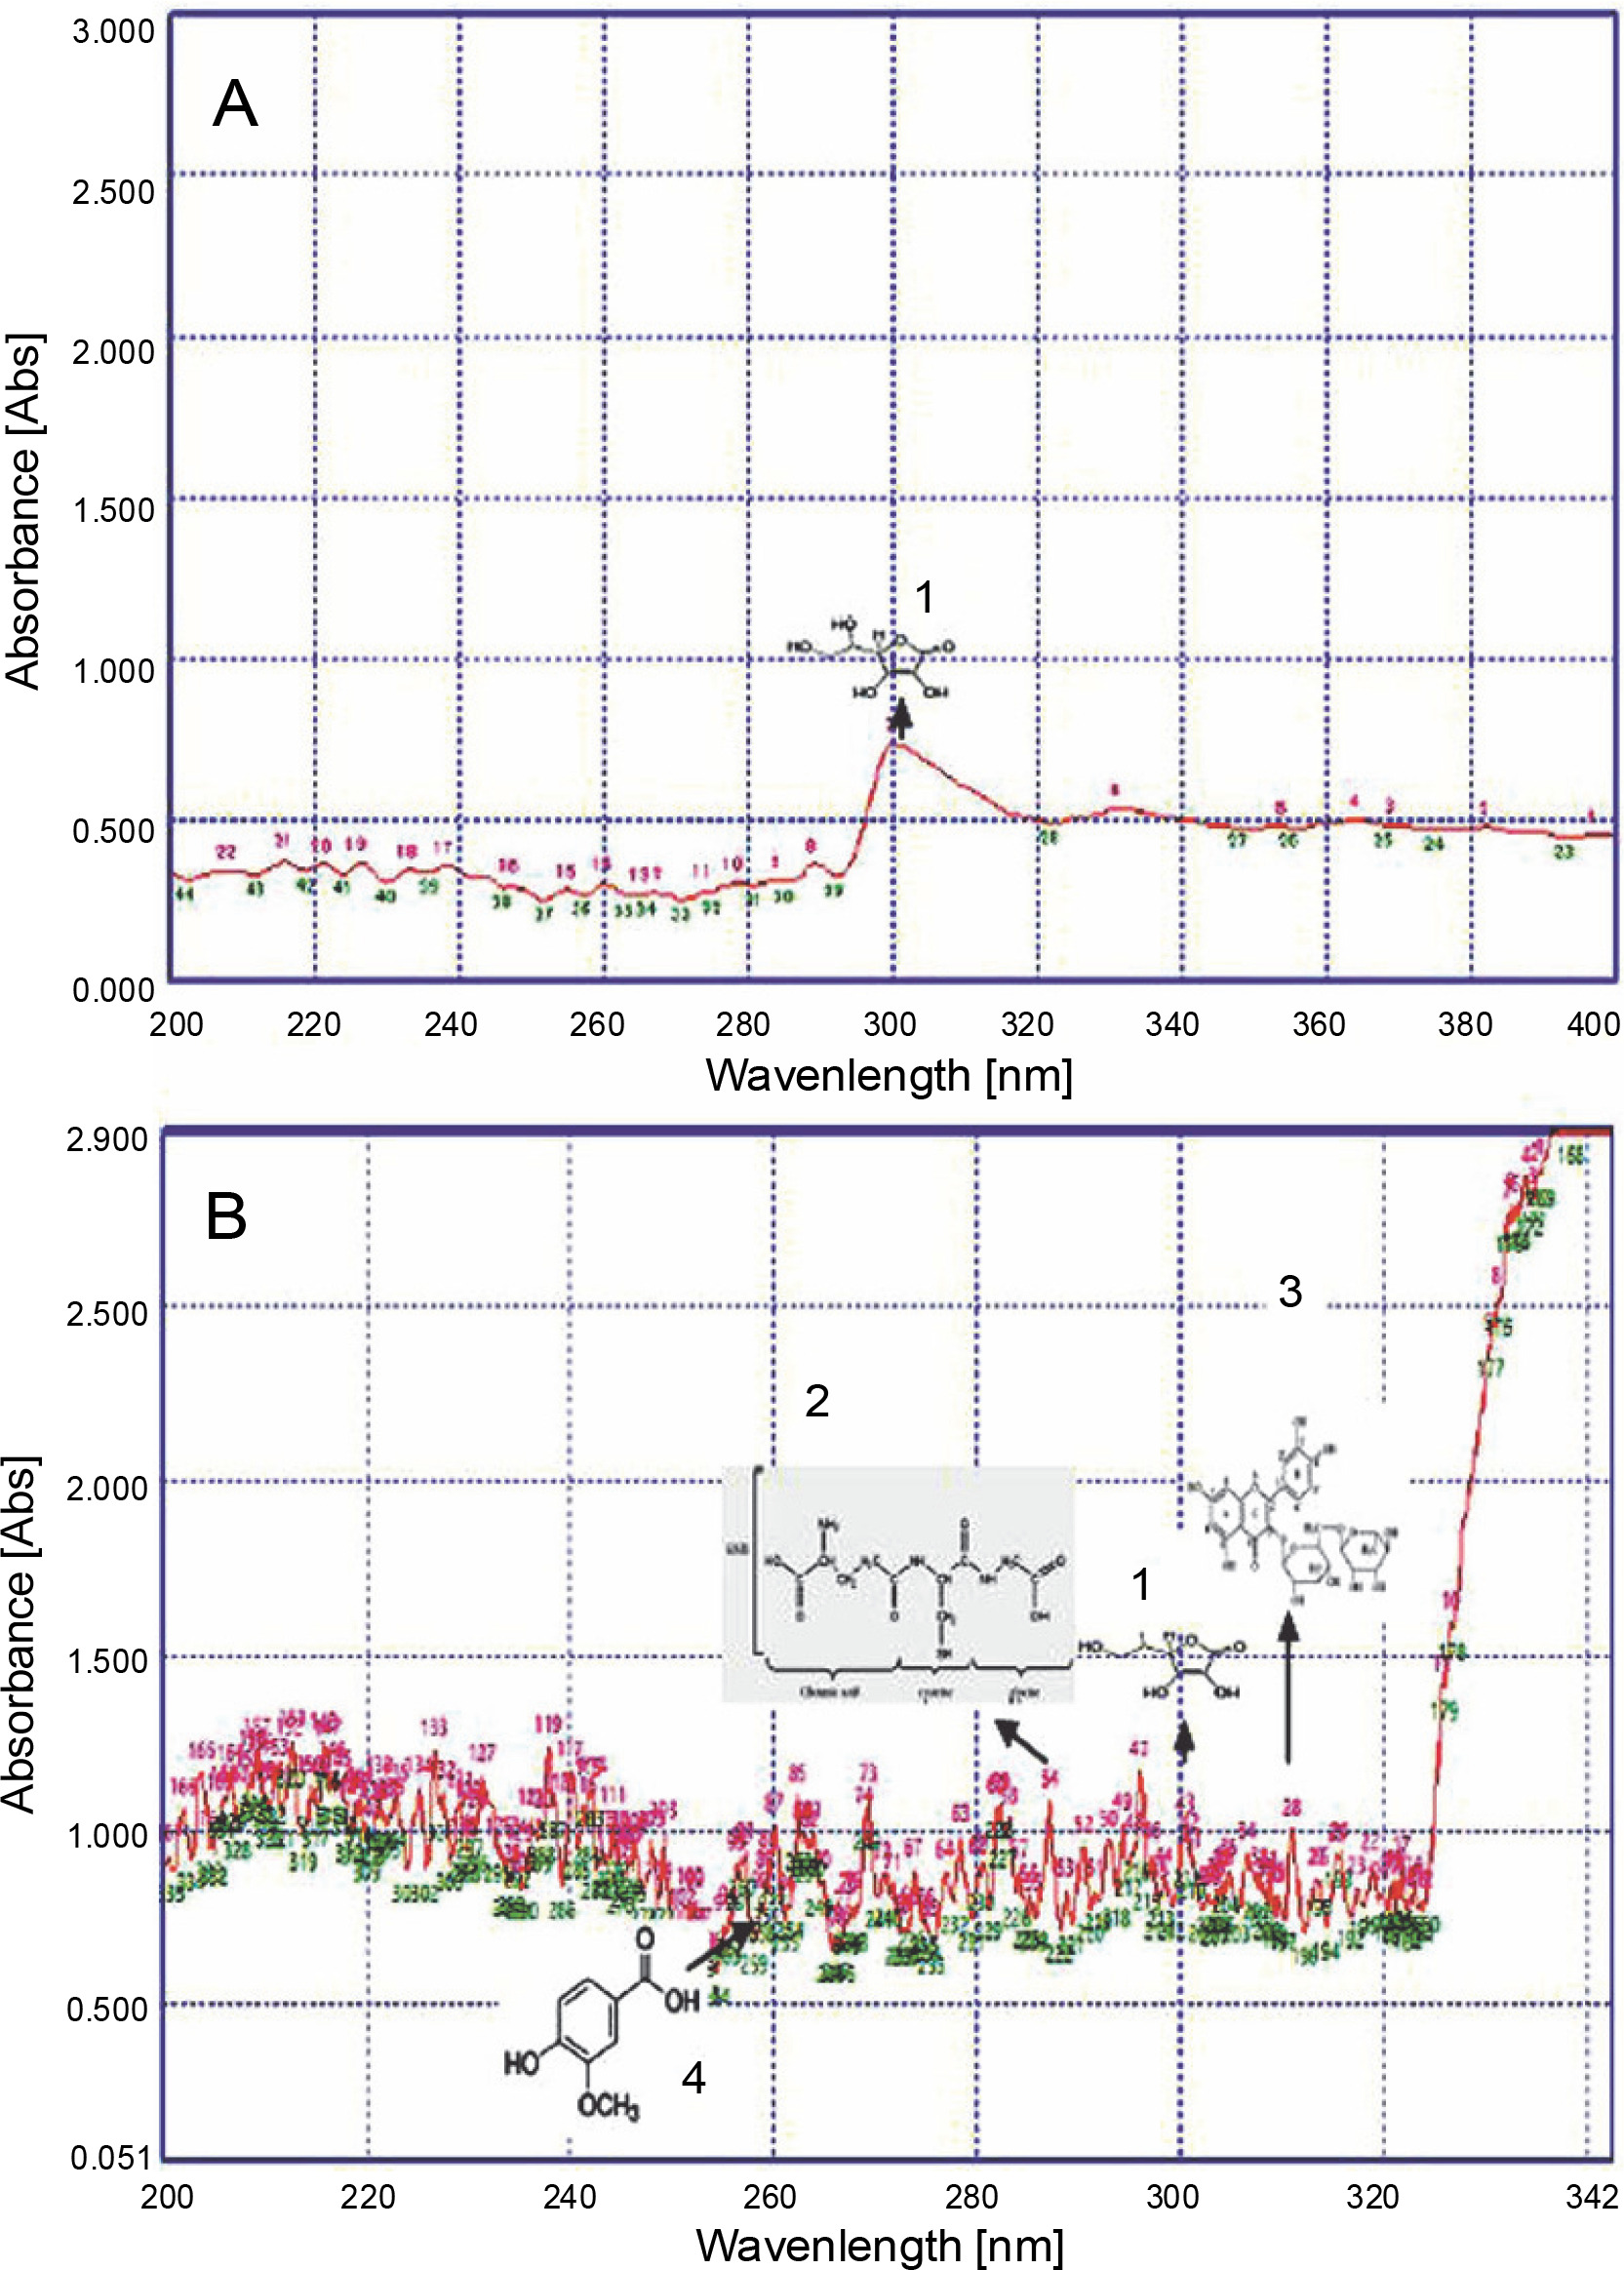
Fig. 4
UV fingerprinting analysis of Ricinus communis leaves extracted in acetone under moderate (A) and hot (B) temperature conditions. Numbers 1, 2, 3, and 4 indicate the presence of ascorbic acid, glutathione reduced, rutin, and vanillic acid, respectively
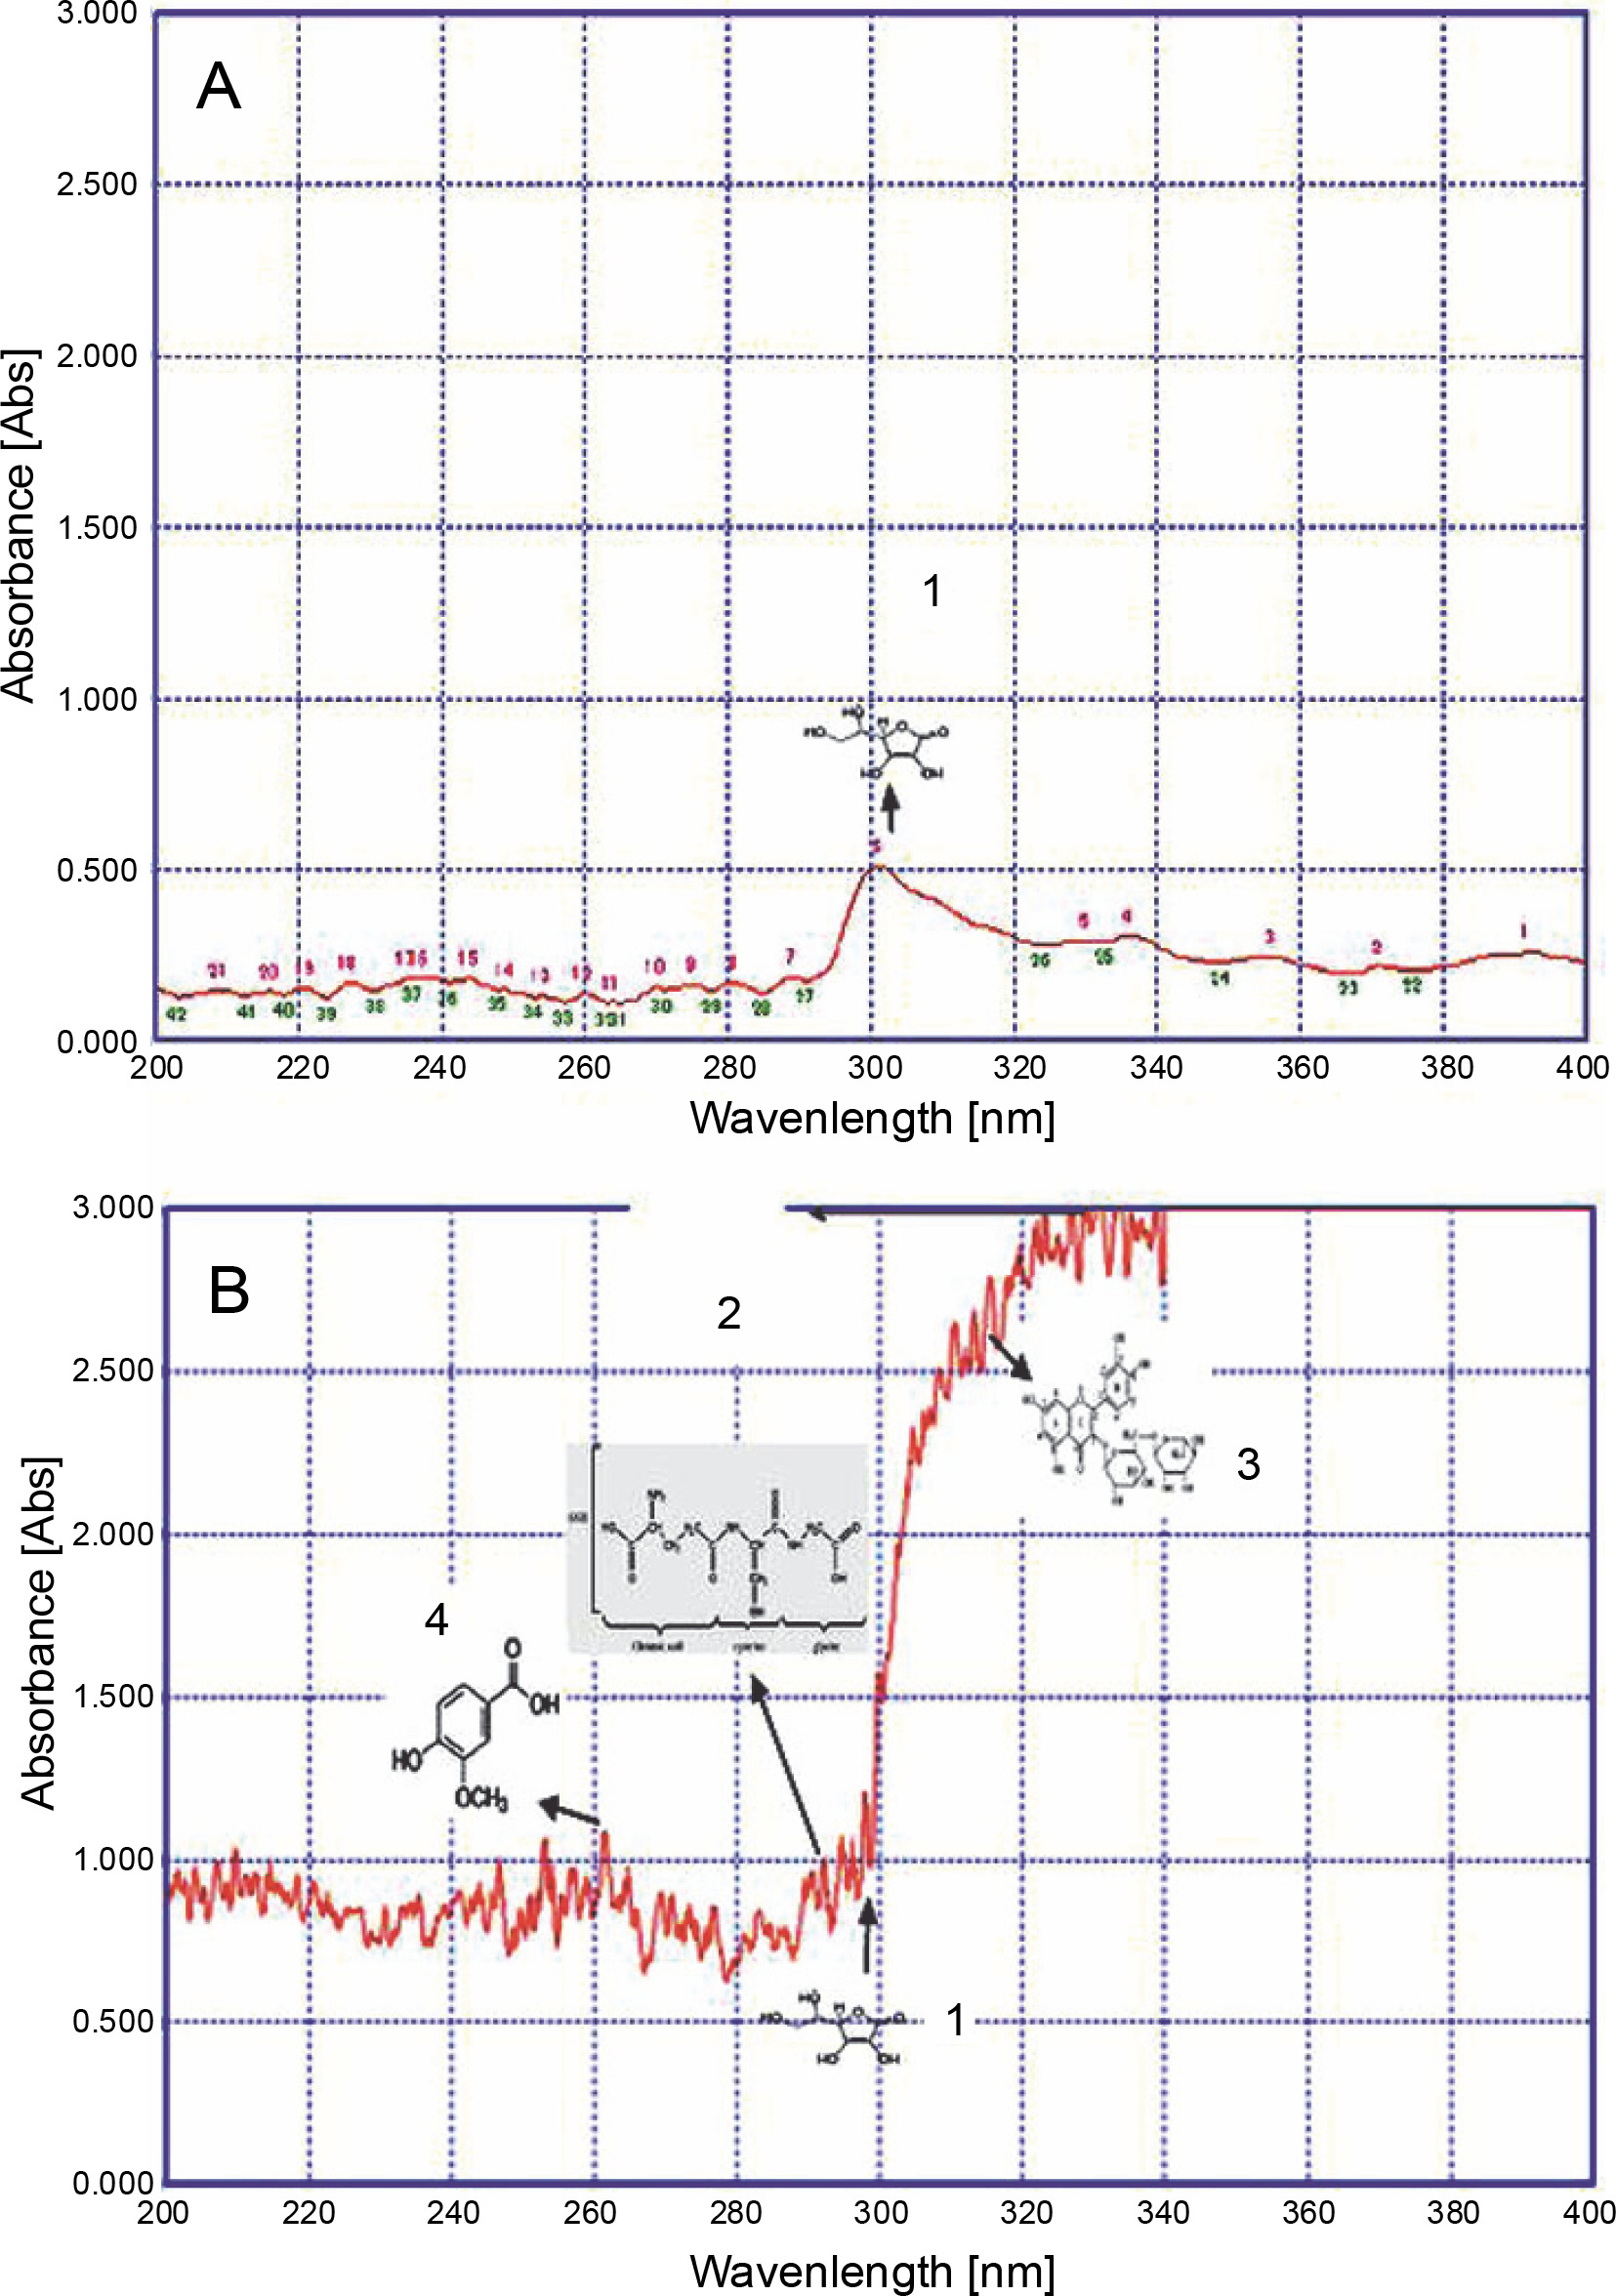
Fig. 5
UV fingerprinting analysis of Ageratum conyzoides leaves extracted in acetone under moderate (A) and hot (B) temperature conditions. Numbers 1, 2, 3, and 4 indicate the presence of ascorbic acid, glutathione reduced, rutin, and vanillic acid, respectively
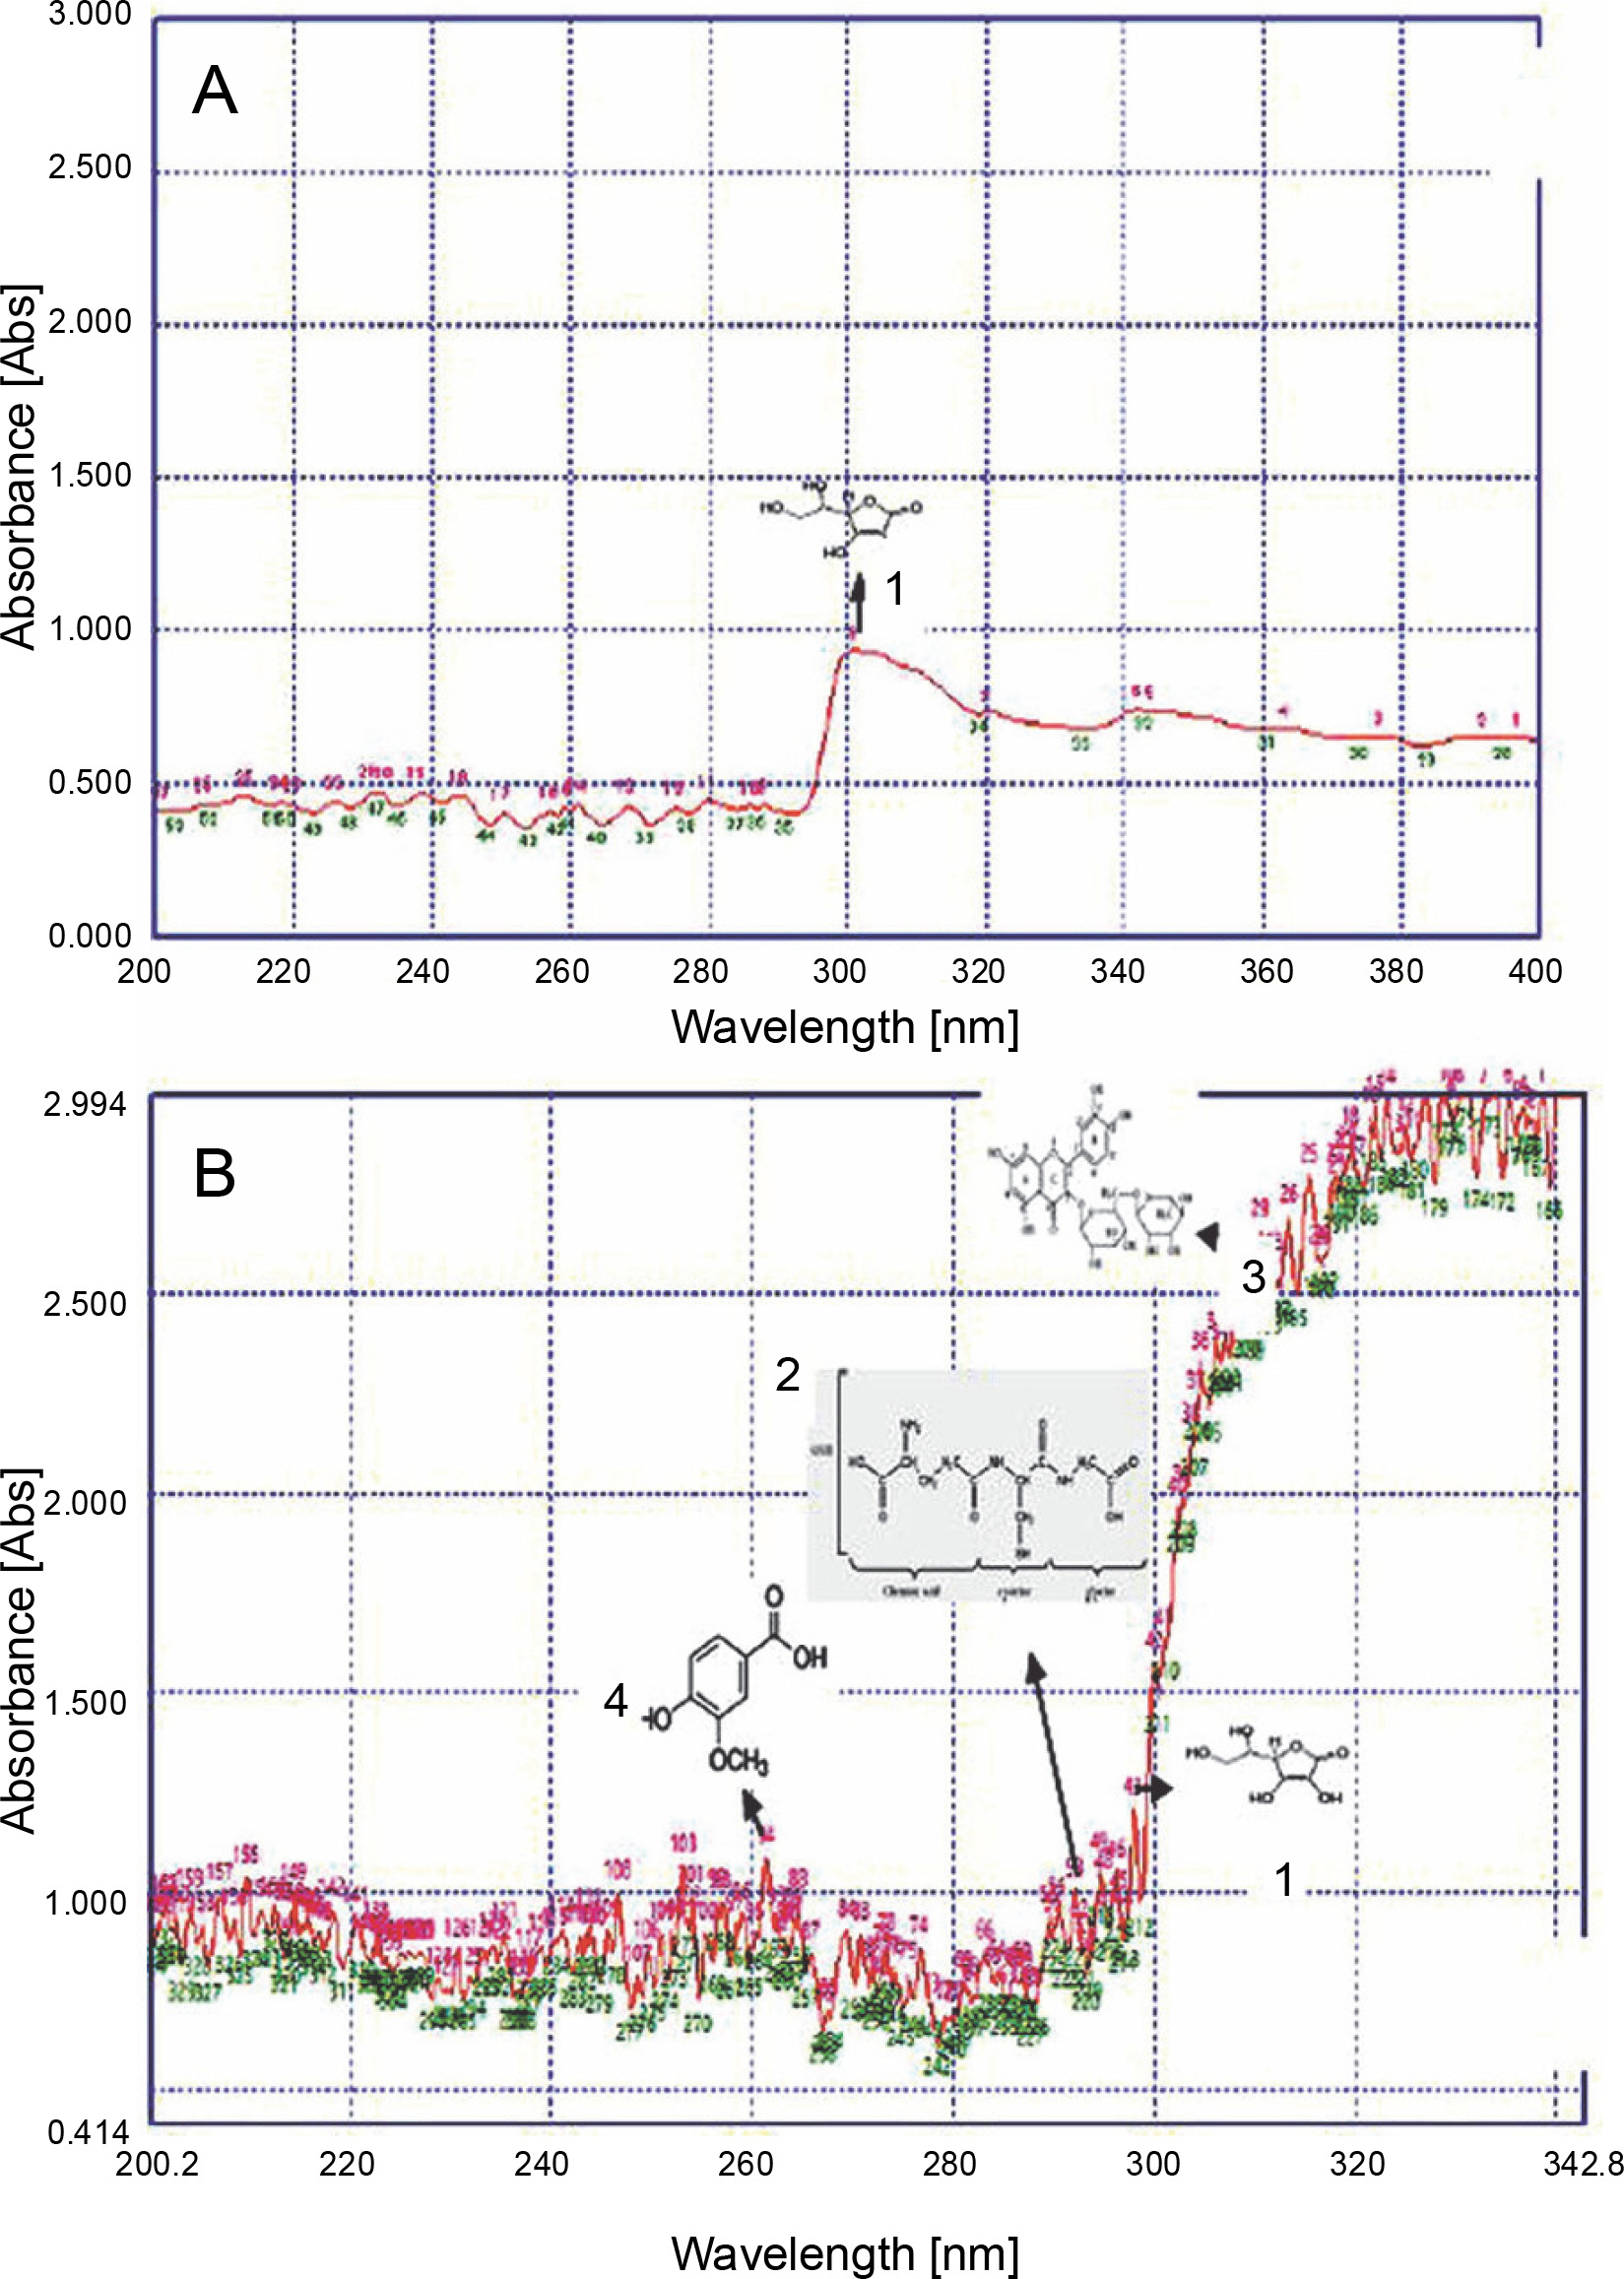
Invasive plants collected at different time periods may considerably differ in their chemical components, thereby resulting in varied chemical profiles (Mera et al., 2019). Guerrini and Sacchetti (2014) reported that the type of plant UV fingerprint is dependent on particular environmental conditions to which the plant is exposed. Genetic and environmental factors, alone or sometimes in combination, influence the metabolic pathways and produce different patterns of chemical composition, thereby leading to variations in fingerprint (Guerrini and Sacchetti, 2014). Therefore, on the basis of the results of the present study, it could be speculated that a high accumulation of secondary metabolites favored the growth of L. camara, P. hysterophorus, A. conyzoides, and R. communis plants under adverse conditions. Qualitative analysis of the compounds was performed to further confirm their identity. The UV fingerprints showed abundant diversity of chemical constituents that were analyzed qualitatively in leaves of all invasive plants extracted in acetone. Eight analytes, namely Rutin, Phenylalanine, Glutathione Reduced, Glutathione Oxidized, Tannic Acid, Glycine Betaine, Proline, and Vanillic acid, were clearly recognized by comparing their frequency of absorbance with those of the components in acetone extracts. From all these analytes, under hot conditions, only 4 compounds were identified in a plant-specific manner. For instance, under adverse hot conditions, three analytes, namely a flavonoid (Rutin) at about 310 nm, an amino acid (glutathione reduced) at about 290 nm, and a phenolic compound (vanillic acid) at about 260 nm, were also identified in L. camara (Fig. 2). However, in P. hysterophorus, A. conyzoides, and R. communis, four analytes, namely ascorbic acid, glutathione reduced, rutin, and vanillic acid were detected (Fig. 3–5). In the present study, ascorbic acid was detected at 300 nm in almost all the plants under moderate conditions (in April). Deneke et al. (2017) also reported the detection of ascorbic acid at 300 nm. However, under hot conditions, the intensity of peaks of ascorbic acid (in terms of absorbance) increased dramatically from 0.5 to 1.2 in L. camara, P. hysterophorus, and A. conyzoide. (Fig. 2–5). Lin et al. (2014) also described enhanced accumulation of secondary metabolites (flavones and flavonols) through chemical fingerprint analysis of Phyla nodiflora (L.) methanol extracts. Scheel et al. (2019) also reported that sunlight exposure induced the accumulation of pheophytin in Coffea arabica (L.) leaves. Delaroza et al. (2014) observed the presence of caffeine, chlorogenic acid, and theobromine in sunlight-exposed leaves of C. arabica (L.). This indicated that hot conditions triggered the accumulation of more UV-absorbing substances. Previous studies have shown that the accumulation of secondary metabolites in plants depends on their biological factors such as genotype, age, and plant organs and environmental factors such as temperature, light, and water stress (Isah 2019).
Table 3
Total number of peaks detected by UV spectroscopy in acetone extracts of leaves of invasive plant species exposed to moderate and hot temperature conditions
| Series number | Plant | Condition | Total number of detected peaks |
|---|---|---|---|
| 1 | LC | moderate | 22 |
| hot | 323 | ||
| 2 | PH | moderate | 22 |
| hot | 335 | ||
| 3 | RC | moderate | 27 |
| hot | 344 | ||
| 4 | AC | moderate | 21 |
| hot | 250 |
Table 4
Fluorescent spectroscopy analysis of acetone extracts of leaves of invasive plant species subjected to different temperature regimes
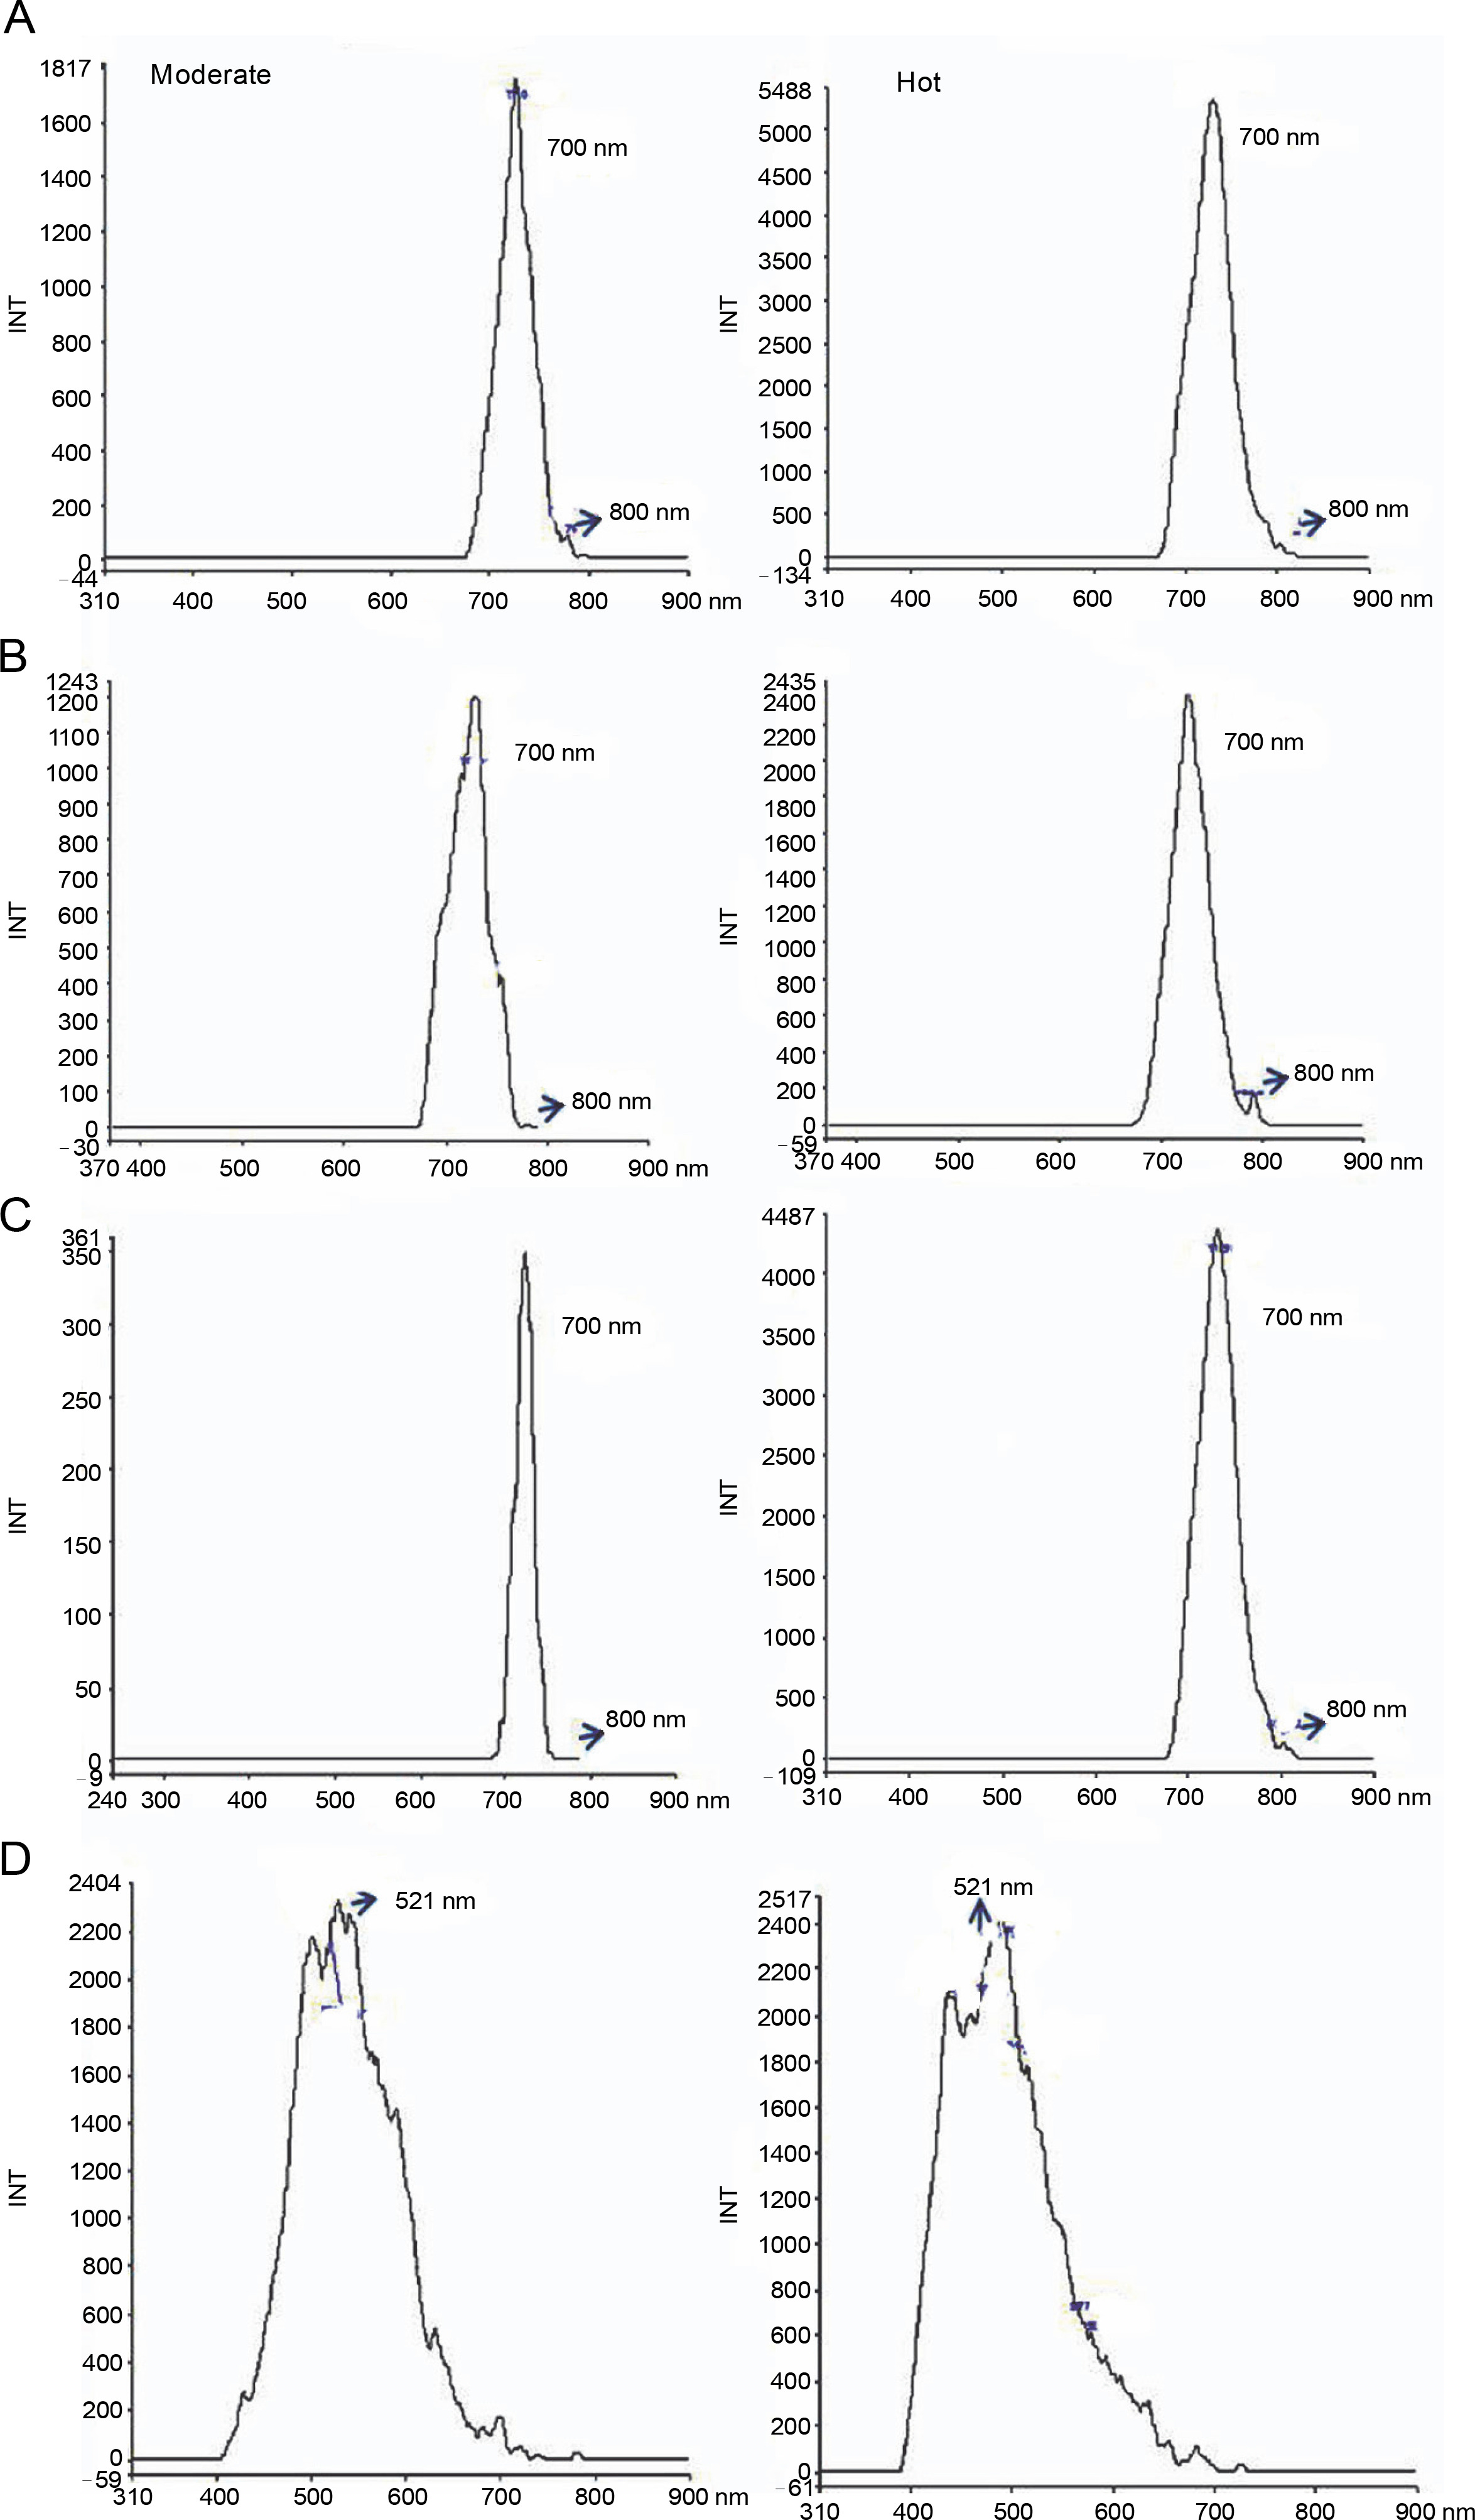
Autofluorescent molecules are abundant in plant cells, and their spectral images are often used to analyze their spectra, which provide information about their accumulation and function under environmental conditions (Mylle et al., 2013; Talmond et al., 2015). In the present study, the fluorescence emission spectra of acetone extract of leaves of L. camara L., P. hysterophorus L., A. conyzoides L., and R. communis L. under moderate and hot conditions were analyzed. As shown in Fig. 5, different spectral signatures of leaves extracted in acetone under moderate and hot conditions were found according to the excitation maxima. A peculiar spectral fingerprint was detected for the leaf extracts of L. camara, P. hysterophorus, A. conyzoides, and R. communis. One major peak at approximately 700 nm (red fluorescent region: alkaloids, polyacetylenes) was detected in L. camara, P. hysterophorus, and R. communis under both moderate and hot conditions (Fig. 6). Interestingly, when the plants were exposed to hot conditions, the fluorescence quantum yield increased dramatically in the invasive species L. camara L., P. hysterophorus L., and A. conyzoides L., which was attributed to the presence of anthocyanins (Talamond et al., 2015). The order of increase of the fluorescence quantum yield under hot conditions was 12-fold in R. communis, followed by 2.9-fold in L. camara, and 1.9-fold in P. hysterophorus. Notably, in A. conyzoides, one major peak was also noted at 510 nm (green fluorescent region), with a minor increase in the fluorescence quantum yield under hot conditions. Different metabolites such as proteins, coenzymes, flavonoids, phenolics, alkaloids, chlorophylls, and cell wall components when excited with radiation of a suitable wavelength behave as autofluorescent molecules (Talmond et al., 2015). Biomolecules detected in the green fluorescent region may be attributed to flavins, terpenoids, and flavonoids (Mylle et al., 2013). Moreover, some minor peaks at approximately 800 nm with varying fluorescence intensity were also noted for L. camara, P. hysterophorus, A. conyzoides, and R. communis under moderate and hot conditions. Cellular structures are believed to be protected from harmful effects of abiotic stresses by the accumulation of fluorescent secondary metabolites such as terpenoids, carotenoids, and phenolics, which are important for the normal growth and development of plants (Talamond et al., 2015; Isah, 2019). The fluorescence emission spectrum of a particular plant can be considered as its molecular signature that reflects its response to environmental (biotic or abiotic) stresses and can reveal the significance of secondary metabolites (Talamond et al., 2015).
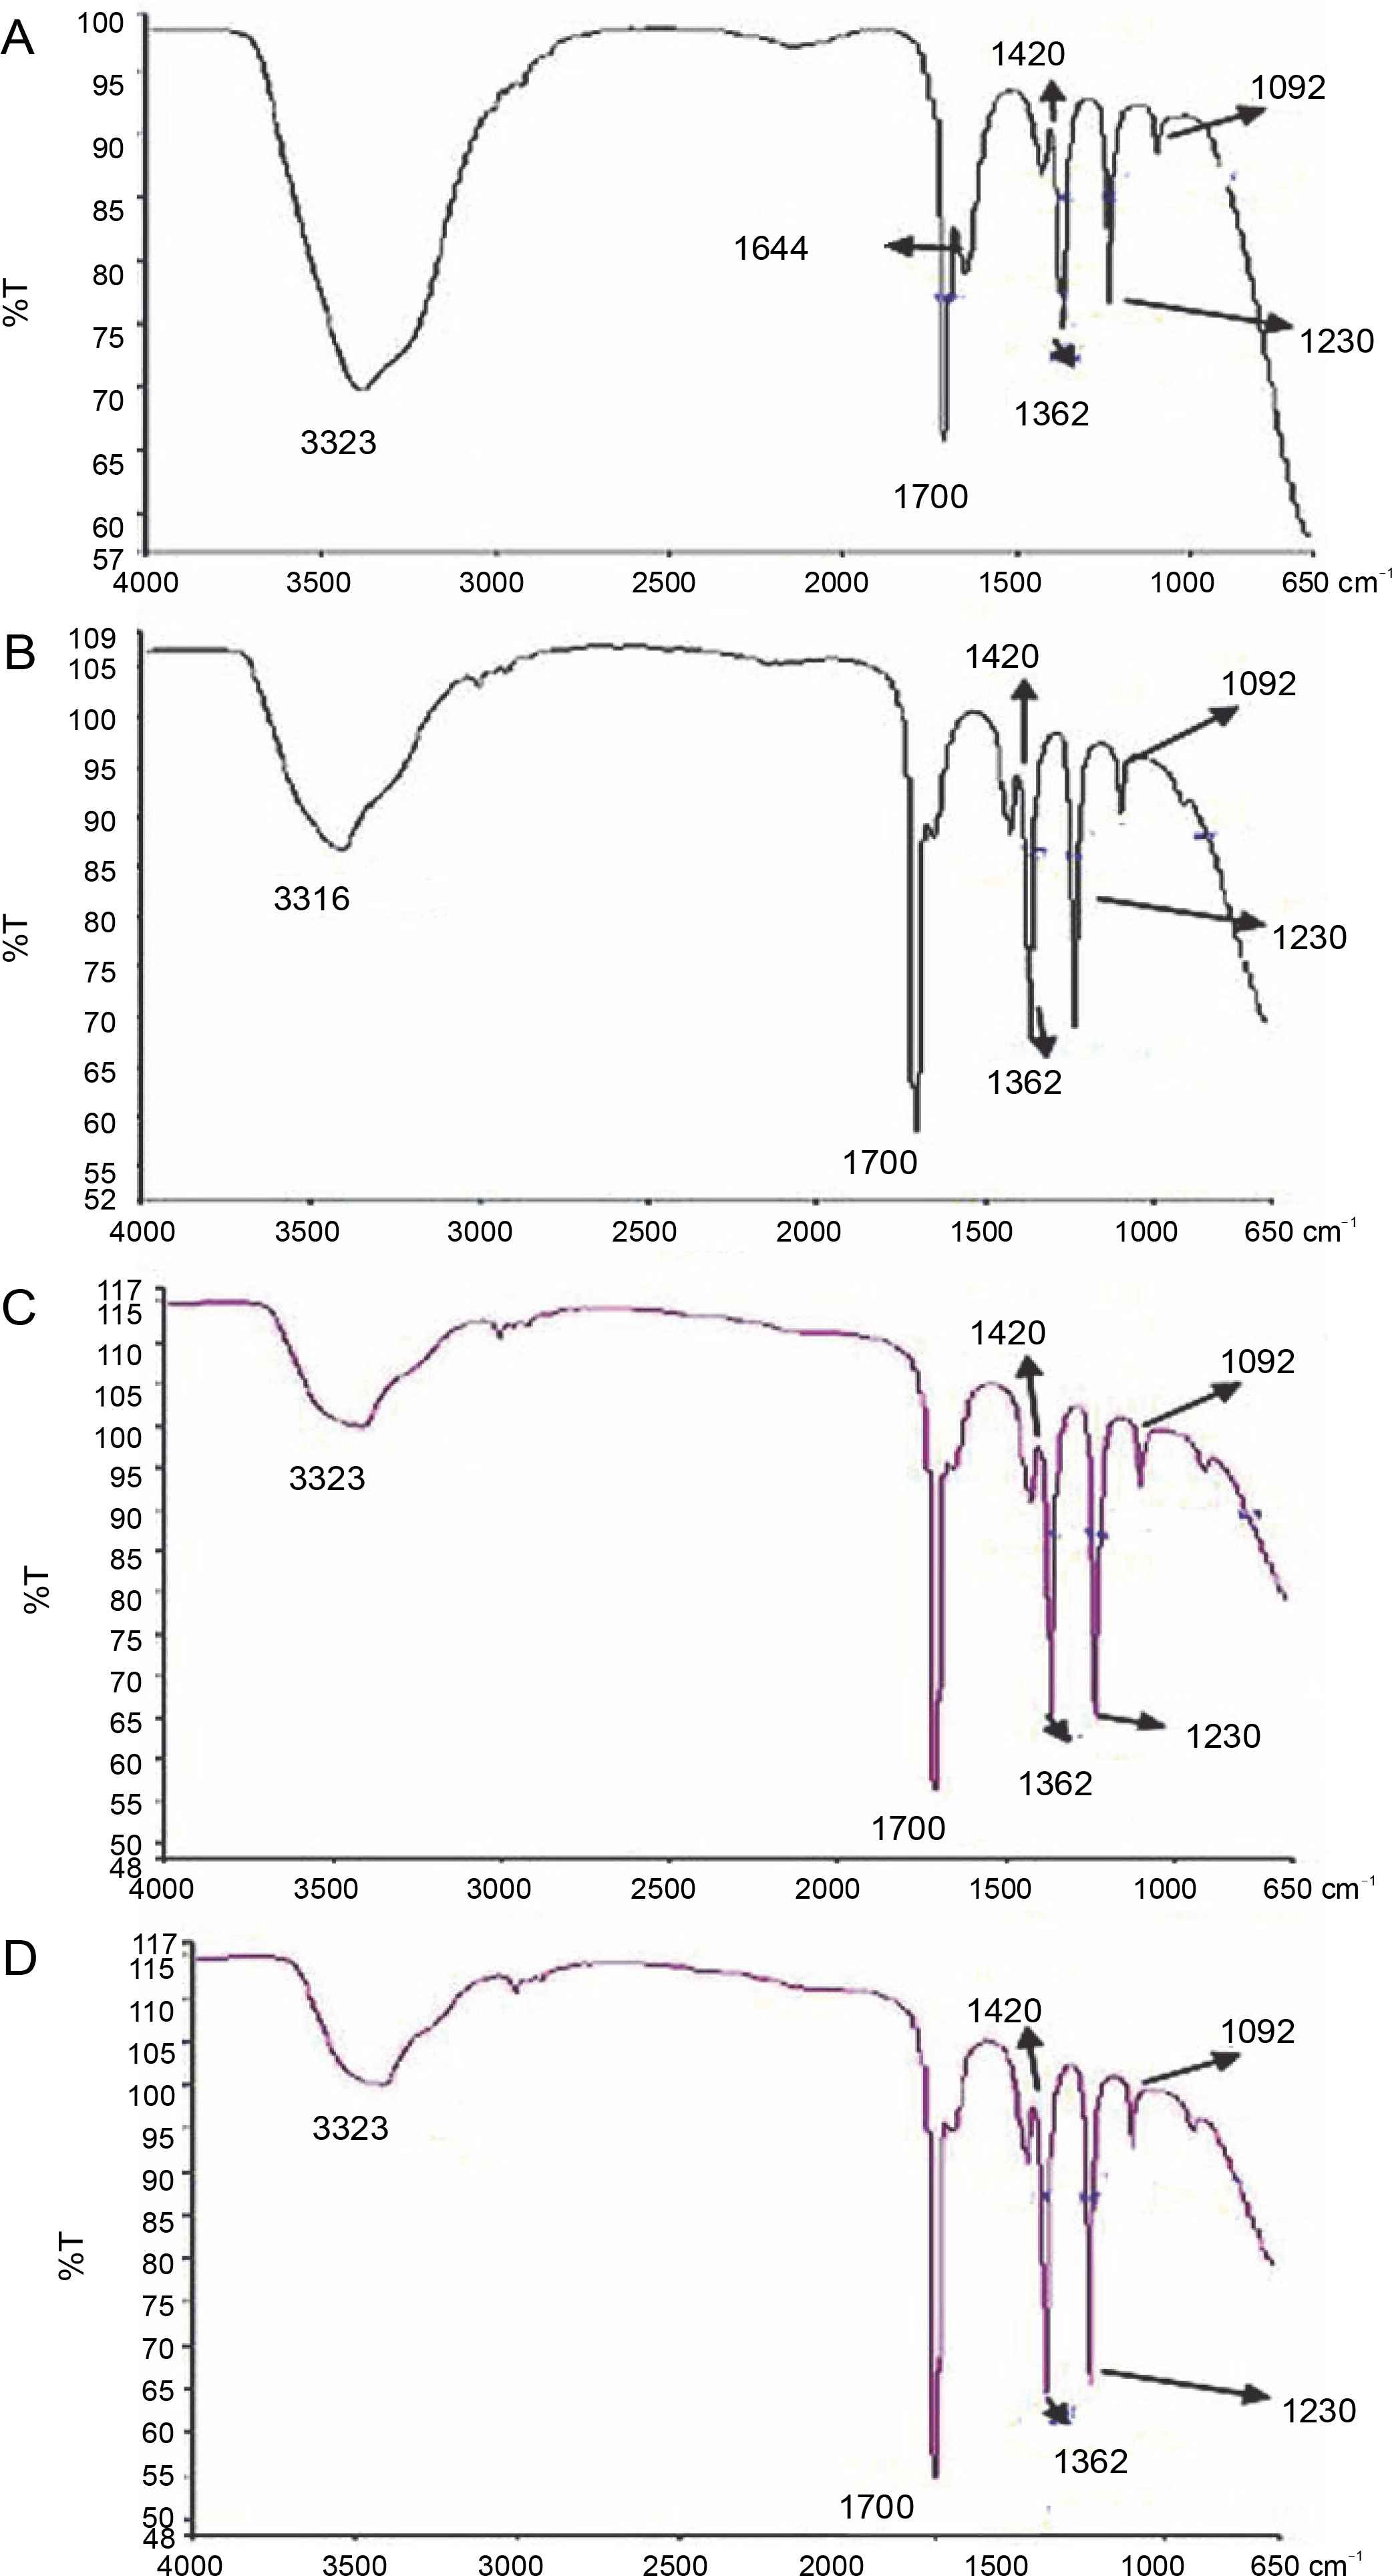
Fig. 6
Fluorescent spectrum analysis of Lantana camara (A), Parthenium hysterophorus (B), Ricinus communis (C), and Ageratum conyzoides (D) extracted in acetone under moderate and hot temperature conditions; the arrow shows the presence of minor peaks
Furthermore, FT-IR spectroscopy was used to determine the presence of functional groups on secondary metabolites under hot conditions. This technique is perhaps the most powerful tool for detecting the types of bonds and functional groups/chemical bonds present in phytochemicals. (Chen et al., 2016). The FT-IR profile under hot conditions is shown in Fig. 7. In the FT-IR spectra, acetone extracts of leaves of L. camara, P. hysterophorus, A. conyzoides, and R. communis showed a broad peak at 3500 cm–1, which indicated the presence of O–H stretching that might be due to the presence of alcohols. Oliveira et al. (2016) also reported peaks at 3500 cm–1 for Punica granatum due to O–H stretching of alcohols. Notably, in L. camara, P. hysterophorus, A. conyzoides, and R. communis, a sharp new peak emerged at 1700 cm–1 due to C=C bending, which indicated the presence of alkenes. Jain et al. (2016) also ascribed peaks around 1700 cm–1 to alkenes in Mentha spicata and Bashyam et al. (2015) in Bryonopsis laciniosa. Notably, in L. camara alone, a sharp band at 1644 cm–1 was detected that could be related to C=C stretching vibration of aromatic rings and to the vibration of N–H of amines and C=O of amides and carboxylic groups. This observation was in agreement with Oliveira et al. (2016) for Punica granatum. The band at 1420 cm–1 due to bending (δ) vibration of C–H could be related to CH3, CH2, flavonoids, and aromatic rings in Bryonopsis laciniosa as indicated by Silva et al (2014) and Propolis and Bashyam et al. (2015). Peaks at approximately 1362 cm–1 were due to carboxylic acids, esters, and ethers and those at 1092 cm–1 could be due to C–O stretching and –OH deformation of secondary alcohols as reported by Oliveira et al. (2016) in Punica granatum and Bashyam et al. (2015) in Bryonopsis laciniosa. Hence, FT-IR spectrum also confirmed the presence of functional groups such as aromatic compounds, alcohols, phenols, alkanes, alkynes, and amines in acetone extracts under hot conditions in all the plants. All these compounds belong to the secondary plant metabolites (Paulraj et al., 2011). Each of the plant species shows varying characteristics such as different peak shapes, numbers, position, and intensity, indicating the presence of different groups of secondary metabolites. The presence of these secondary metabolites could be responsible for stress resistance of plants to abiotic conditions.
Conclusion
In L. camara, P. hysterophorus, A. conyzoides, and R. communis, a coordinated increase in secondary metabolites was observed by UV spectral chemical fingerprinting. Higher accumulation of metabolites indicated their effectiveness in protecting the plants from the accumulation of ROS under high and low temperature conditions. Taken together, it can be concluded that as environmental conditions become less conducive, such as high temperature and cold, invasive plants adapt themselves by accumulating high levels of secondary metabolites. However, besides the effect of temperature observed in this study, the effect of other factors such as light quality, intensity, plant age, and rainfall regime on changes in metabolite accumulation cannot be ruled out. Therefore, it is hypothesized that the accumulation of metabolites such as ascorbic acid, glutathione reduced, rutin, and vanillic acid, contributes to the protection of L. camara, P. hysterophorus, A. conyzoides, and R. communis plants against heat stress.