


Introduction
Annual pepper (Capsicum annuum L.) is a horticultural plant with a steady consumer interest. The content of desired minerals and compounds in annual pepper, namely calcium, iron, vitamins (A, C, and B), phenols, flavonoids, and carotenoids, determines the high nutritional and health value of the plant (Arimboor et al., 2015; Mo et al., 2015). The interaction of capsaicinoids with other bioactive compounds expands the use of pepper for pharmacological purposes, mainly through its anti-inflammatory and antioxidant properties (Heghes et al., 2015). In addition, pigments obtained from pepper are widely used not only in food coloring but also in cosmetics and pharmaceutical industry (Nadeem et al., 2011). The extensive use of pepper has led to a demand for the development of new varieties with specific properties that meet the diverse requirements of customers. Obtaining a plant variety with a high agronomic potential in the range of desirable traits is mainly based on the natural and induced variability of C. annuum L. (Paran et al., 1998; Adetula, 2006). The huge variety of breeding materials of this species implies that traditional methods based on the description of morphological traits are not always sufficient for their characterization and identification (Shapturenko et al., 2014; Olszewska et al., 2017). In addition, to ensure repeatability of phenotypic traits, it is necessary to ensure their genetic homogeneity. Molecular analyses that characterize diversity at the DNA level are frequently used for this purpose. Among these analyses, the random polymorphic DNA amplification (RAPD) technique, which identifies polymorphisms of randomly amplified DNA fragments, is one of the most commonly used techniques. RAPD markers have been successfully used to analyze genetic diversity in the genus Capsicum (Livingstone et al., 1999; Rodriguez et al., 1999; Costa et al., 2006; Ince et al., 2010). They have also been used to identify interspecific and intraspecific pepper hybrids (Mongkolporn et al., 2004; Niklas-Nowak and Olszewska, 2018), and they enabled to assess polymorphisms of closely related C. annuum L. genotypes (Lefebvre et al., 2001; Tilahun et al., 2013; Shapturenko et al., 2014).
In the present study, the PCR-RAPD technique was used for the molecular analysis of the generative offspring of three cultivars of pepper, namely “Anchi”, “Luba”, and “Sono”, and their forms with different fruit colors. Their presence, caused by a spontaneous mutation or change in the segregation of recessive alleles, may be a potential source of a new genetic variability in pepper breeding programs.
Materials and methods
Plant material
The plant material consisted of three large-fruited cultivars: “Anchi”, “Luba”, and “Sono”. These are sweet, medium-early varieties of pepper, with intensive growth and intended for cultivation under polytunnel. The “Luba” and “Sono” cultivars were obtained by breeding procedures within the C. annuum L. species, while the “Anchi” cultivar was derived from the interspecific hybrid of C. annuum × C. chinense. The yellow-fruit cultivar “Sono” and the red-fruit cultivar “Anchi” are characterized by a triangular shape of the fruit. The “Luba” cultivar, on the other hand, bears red, block, fleshy fruits. In 2017–2019, individual plants with different fruit colors were obtained by cultivation of the studied genotypes: yellow for “Anchi” and “Luba” and red for “Sono”. The analyzed seedlings were obtained through self-pollination. They represented individual plants with yellow and red fruit color obtained in the “Anchi”, “Sono” and “Luba” cultivars. Plants from each group were grown in a polytunnel until they were fully ripe. The phenotypic evaluation confirmed the stability of the fruit color of all the analyzed genotypes. All materials originated from the collection maintained by the Department of Agricultural Biotechnology, the University of Sciences and Technology in Bydgoszcz, Poland.
DNA isolation, PCR-RAPD, and polymorphism analyses
Total DNA was isolated from 100 mg tissues of three randomly selected seedlings of each genotype: “Anchi” with red fruit (isolates numbered 1–3), “Anchi” with yellow fruit (4–6), “Luba” with red fruit (7–9), “Luba” with yellow fruit (10–12), “Sono” with yellow fruit (13–15), and “Sono” with red fruit (16–18).
DNA isolation was performed for each group of plants by using two methods: the GenEluteTM Plant Genomic DNA Miniprep kit (Sigma-Aldrich) for isolates numbered: 1, 2, 4, 5, 7, 8, 10, 11, 13, 14, 16, and 17, and the Genomic Mini (SPIN) kit (A&A Biotechnology) for isolates numbered: 3, 6, 9, 12, 15, and 18. The quality of DNA was evaluated spectrophotometrically, and electrophoresis was performed on a 1% agarose gel. Taq polymerase (A&A Biotechnology) and 26 RAPD primers (synthesized in the Laboratory of DNA Sequencing and Oligonucleotide Synthesis, IBB PAS) were used for DNA amplification. PCR-RAPD reactions were performed according to the method developed for C. annuum L. (Olszewska et al., 2017) in the ATC 401 Thermal Cycler. All reactions were performed twice, and the products were separated on a 1.8% agarose gel stained with ethidium bromide. Electrophoresis was conducted for 2 h at 100 mV. The size of the obtained bands was determined using a molecular weight marker GPB 3000 bp DNA Ladder Mix (GenoPlast Biochemicals) and the computer program GelAnalyzer 2010a (http://www.gelanalyzer.com/). The GelDoc 2000 UV transilluminator was used to visualize the obtained DNA fragments.
The number of monomorphic and polymorphic amplification products generated by each primer was determined. The Polymorphism Information Content (PIC) was calculated according to the formula of Ghislain et al. (1999): PIC = 1 – p2 – q2, where p is the band frequency and q is no band frequency. Estimates of genetic distances were calculated for all accessions according to the protocol of Nei and Li (1979), and a dendrogram was constructed using the unweighted pair group method with arithmetic mean (UPGMA) and the software Treecon ver. 3.1 (Van de Peerand and De Wachter, 1994). Statistical support of the branches was tested with the bootstrap analysis using 2000 replicates.
Results and discussion
A precise identification of plant materials is a critical aspect of successful plant breeding programs. Conventional methods describing the morphological characteristics of plants are not always sufficient for this purpose; hence, such approaches are extended to include cytogenetic or molecular analyses (Lefebvre et al., 2001; Niklas-Nowak and Olszewska, 2018). The RAPD method is considered to be an effective, rapid, and cheap solution for molecular characterization; however, it is essential to confirm the repeatability of the results obtained using the experimental methodology (Bhadragoudar and Patil, 2011; Olszewska et al., 2017). In the present study, the analysis of pepper cultivars, namely “Anchi”, “Luba”, and “Sono”, which vary in terms of fruit color, was performed in two experimental variants by using DNA isolation kits from Sigma-Aldrich and A&A Biotechnology.
Two DNA isolation kits were used to verify the repeatability of the obtained results. Of the 262 bands obtained following the reaction with 26 primers, only two differentiated products of the RAPD reaction were found to depend on the method of DNA isolation (Table 1). An additional band obtained from the reaction with primer A16 (1280 bp) was present for all the plants for which the A&A Biotechnology kit was used. This product was defined as monomorphic because it did not differentiate the studied genotypes; therefore, the PIC coefficient was not calculated in this case. In contrast, the additional band for “Luba” (245 bp, Q05) was considered polymorphic because its presence was found only for the “Luba” yellow form.
Table 1
Characteristics of PCR-RAPD reaction products obtained for C. annuum L.: “Anchi” (isolations 1–6), “Luba” (7–12), “Sono” (13–18)
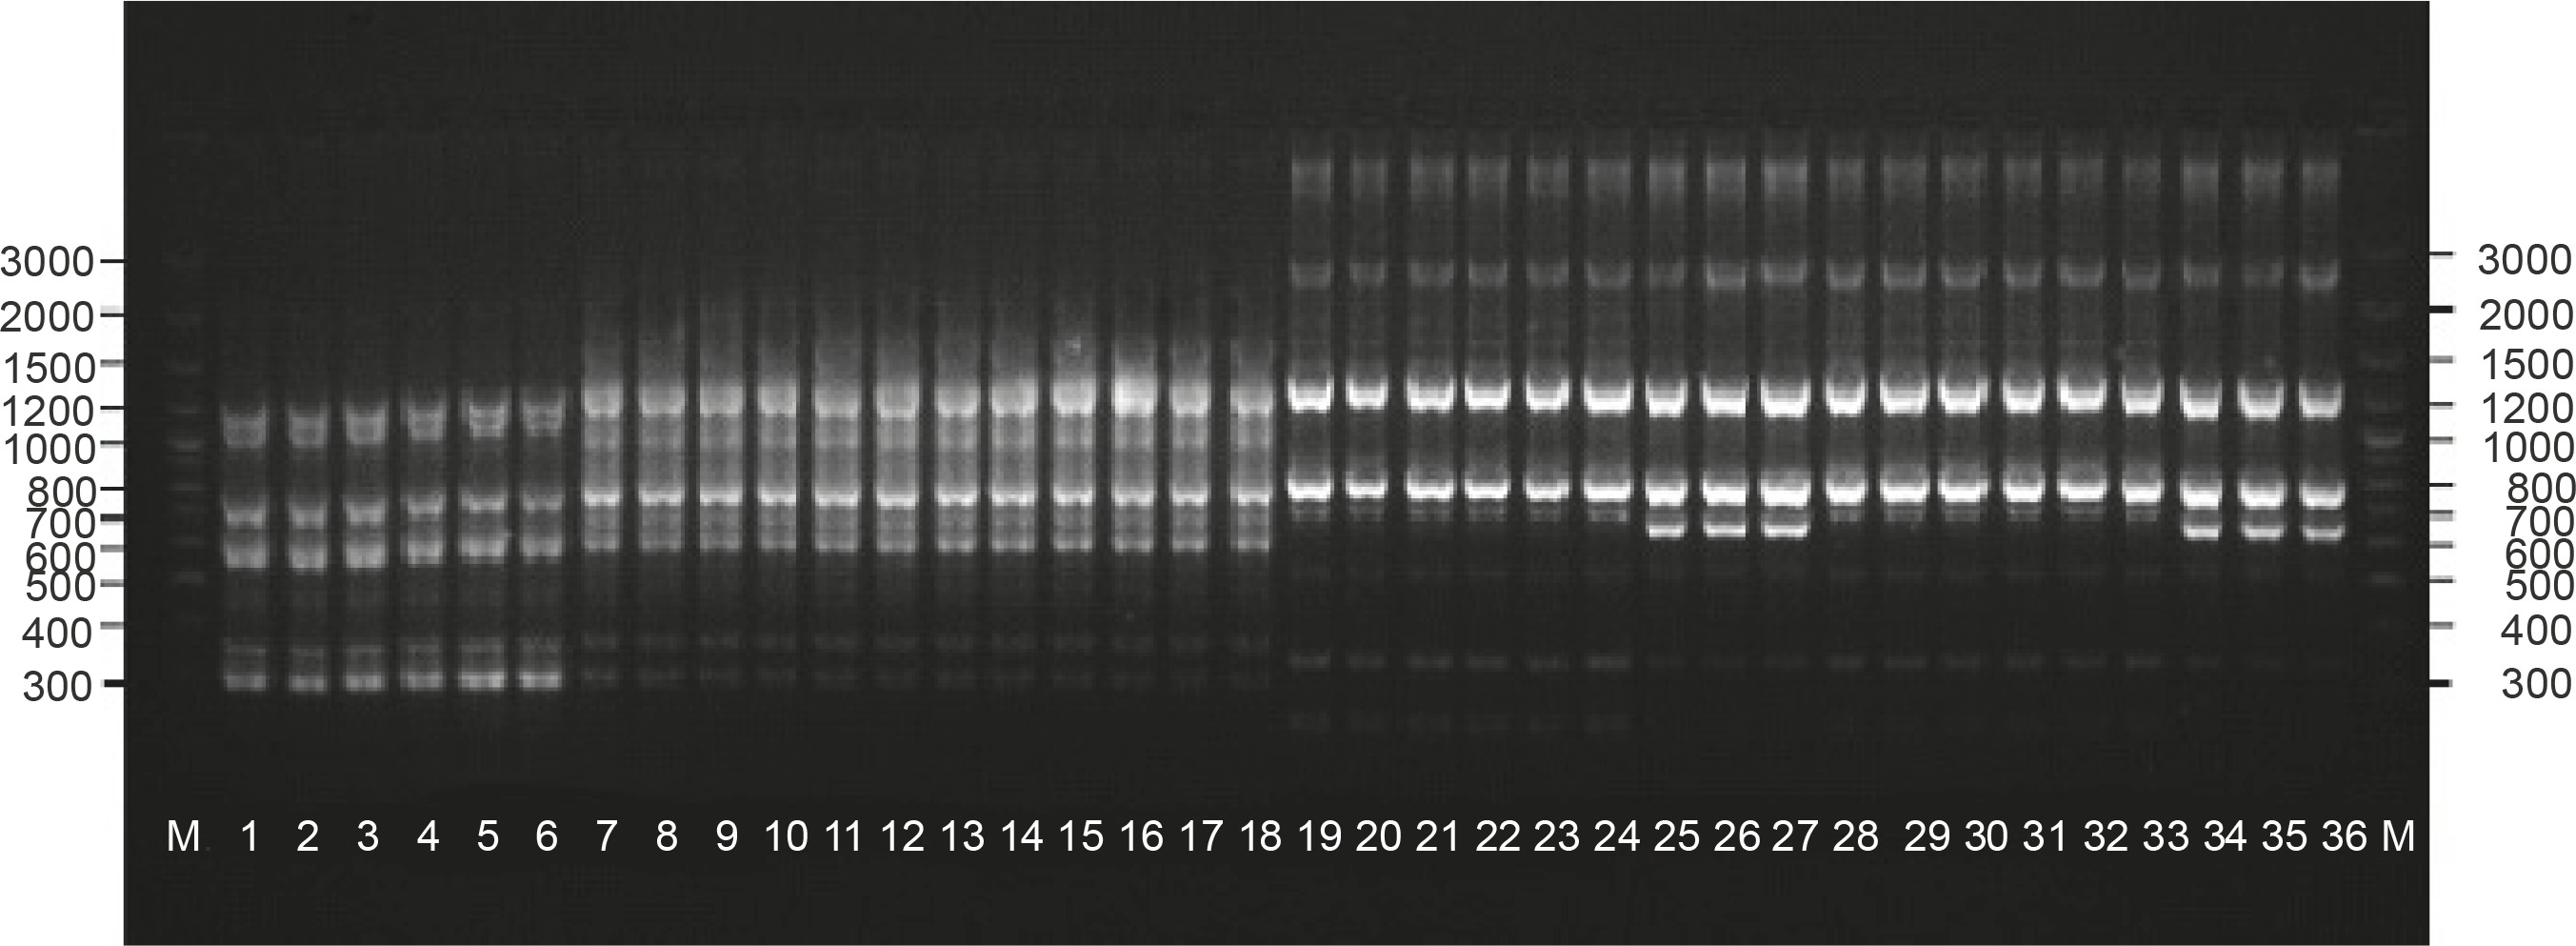
The presence of the remaining 260 repeatable products enabled to identify the diverse plants phenotypically within the cultivars: “Anchi”, “Luba”, and “Sono”. The number of products generated for the used primers ranged from 6 (primers A07 and A15) to 21 (primer G19). For closely related genotypes, the level of polymorphism that can be identified using the molecular markers is a crucial aspect. Bhadragoudar and Patil (2011) conducted studies on 45 genotypes of C. annuum L. by using 16 ten-nucleotide primers and obtained as much as 63% of products of differentiating nature. Tilahun et al. (2013) used 20 primers to analyze 30 genotypes of C. annuum L. and obtained 78 products, 83% of which were polymorphic. Much lower polymorphism rates were observed in the studies of Shapturenko et al. (2014), where the use of 21 primers to analyze 10 C. annuum L. lines revealed a polymorphism level of 26%. Similarly, Paran et al. (1998) studied the genotypes of C. annuum L. by using 21 primers and obtained 158 bands, 22% of which were polymorphic. In the present experiment, 5.2% polymorphic bands were obtained from the performed reactions. Eight of the used primers generated 12 polymorphic products that allowed to identify all the tested genotypes. Thus, it seems that generation of the highest possible proportion of polymorphic products for the studied genotypes is the most important aspect while selecting primers. Bhadragoudar and Patil (2011) in their study provided detailed information on primer polymorphism, which indicates that among the used primers, only two were highly polymorphic and showed a differentiation of 88 and 83.3%, which was much better than the average polymorphism of primers. In our study, differences in the effectiveness of individual primers ranged from 0 to 27.3%. Therefore, a methodical development of the experiment with the application of the RAPD marker system should be conducted with special attention to the individual selection of primers depending on the analyzed materials. In the analyses, four primer-generated products were obtained that differentiated the “Anchi” cultivar: A07 (777 bp), K10 (270 bp), AE10 (621 bp, 975 bp, 1008 bp), and Q07 (550 bp) (Fig. 1). Markers identifying phenotypic forms of different fruit colors were not obtained for this genotype. Starter Q07 was also identified for the “Luba” cultivar based on an additional 789-bp product. Reactions performed with primers B10 and RAD1 showed the presence of 570 bp and 285 bp products characteristic for the “Sono” cultivar (isolates 13–18).
Fig. 1
. The application of the RAPD technique in the identification of the genetic diversity of cultivated forms of C. annuum L.
The PIC calculated for the 10 differentiating RAPD primers ranged from 0.12 to 0.23 (Table 1). Considering the close relationship of the analyzed genotypes, the low PIC values observed in the experiment seems to be reasonable. In previous analyses on the identification of androgenic regenerants obtained from the anther cultures of an interspecific pepper hybrid (C. annuum L. ATZ1 × C. frutescens L.) F1, the PIC values calculated were up to 0.45 (Olszewska et al., 2017). Our results are consistent with the study of Sitthiwong (2005) that estimated genetic diversity in C. annuum.
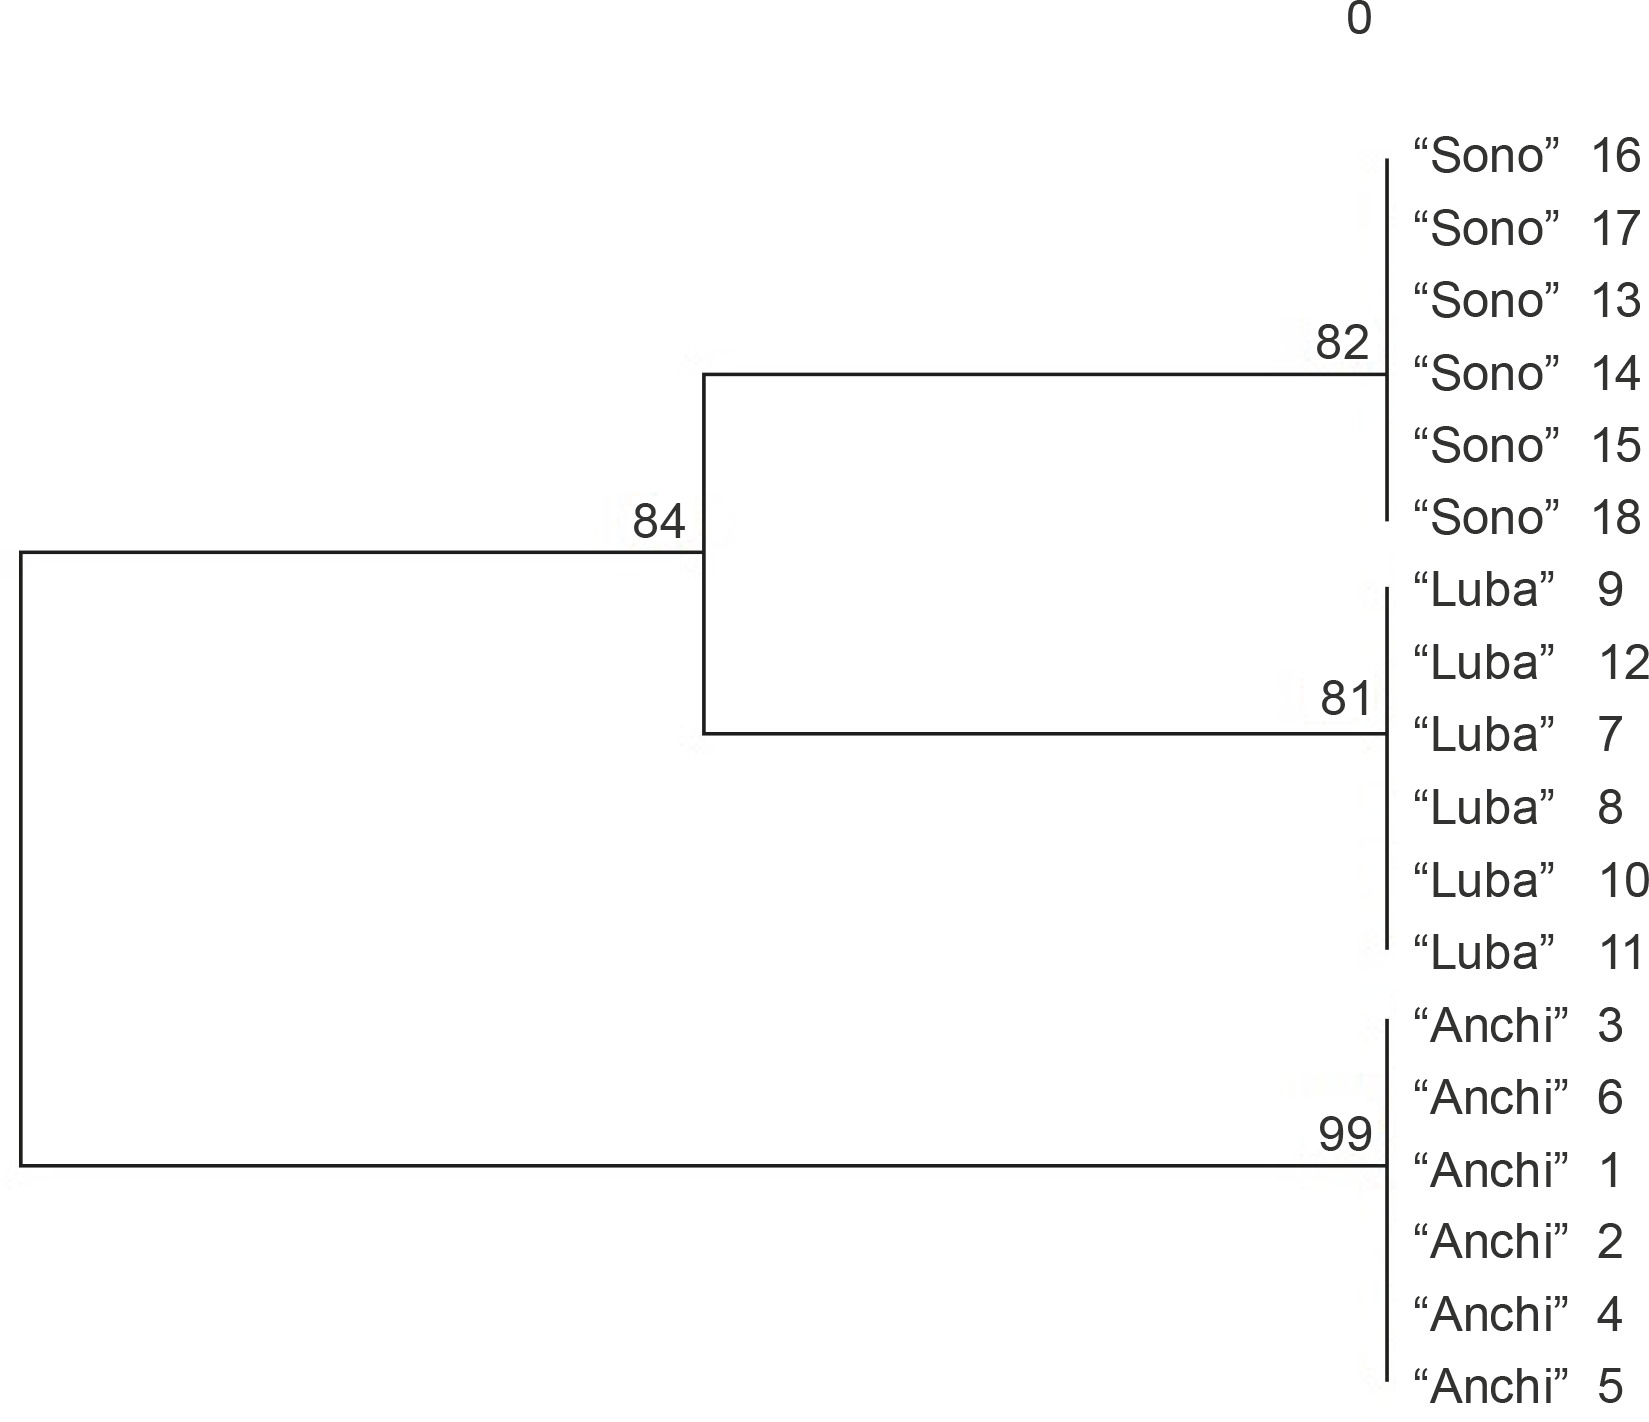
The mutual relationships between the analyzed genotypes are illustrated graphically by a dendrogram constructed using the UPGMA method and the software Treecon ver. 3.1 (Van de Peerand and De Wachter, 1994). The collected data allowed to categorize the tested genotypes into two sections (Fig. 2). One section included red- and yellow-fruited C. annuum L. genotypes “Sono” and “Luba”, while the other section included red- and yellow-fruited “Anchi” genotypes. Genetic distance coefficients calculated using the formula developed by Nei and Li (1979) showed a low level of genetic variation between the analyzed genotypes (Table 2). The low level of molecular polymorphism in the genome of C. annuum was also confirmed by Prince et al. (1995), Paran et al. (1998), and Rodriguez et al. (1999). The authors indicated that the molecular markers used were informative enough to differentiate the representative varietal types of cultivated pepper, and the classification obtained with molecular markers was consistent with the commercial classification of varieties (Lefebvre et al., 2001; Sitthiwong, 2005). The usefulness of RAPD markers for identifying genetic variations in Capsicum species was also reported by Rad (2009) and Thul et al. (2012).
Table 2
Coefficients of genetic distance of Capsicum annuum L. genotypes.: “Anchi” (1–6), “Luba” (7–12), “Sono” (13–18)
Fig. 2
The application of RAPD technique in the identification of genetic diversity of cultivated forms of C. annuum L.
Molecular analyses performed using A15 primer also provided additional information based on a specific product of 645 bp (Fig. 1), which enabled to identify redcolored fruit genotypes in the “Luba” cultivar (isolates 7–9) and “Sono” cultivar (isolates 16–18). Molecular identification of utility traits of crops is an extremely important aspect of the conducted molecular analyses. For this purpose, the RAPD technique was used to identify markers linked to a major fertility restoring gene in pepper (Zhang et al., 2000). Markers characteristic for the soft flesh of pepper fruit have been reported by Rao and Paran (2003). Blum et al. (2002) conducted a molecular mapping of the locus for the presence of pungency-associated genes in Capsicum. Lefebvre et al. (1998) and Huh et al. (2001) analyzed the genes that determine the red color of the mature fruits of pepper. Our analyses are part of the practical application of molecular analyses to search for markers of functional traits and their further use in pepper breeding programs.
Conclusions
RAPD markers are an effective tool in identifying Capsicum annuum L. cultivars. Reactions performed using the primers A07, K10, AE10, Q07, B10, and RAD1 enabled to identify the “Anchi”, “Luba”, and “Sono” genotypes and also demonstrated a low degree of genetic distance between the analyzed cultivars. Additionally, A15 starter generated a specific product of 645 bp that enabled to differentiate yellow- and red-colored fruit forms among the progeny of “Luba” and “Sono” cultivars. The observed diversity creates an interesting perspective in the research on the identification of molecular markers to differentiate red- and yellow-fruit peppers.